With the Bitcoin price taking a bullish reversal, the AI tokens are quick to bounce with the additional demand in the market. Amidst this recovery, the FET price shows a bullish reversal that is ready to take off from a critical support level.
Will the bullish reversal in the Fetch.AI token surpass the overhead resistance trendline this week? Find out more in our price analysis below to find out if this is the best time to invest in the FET token at this price.
Fetch.AI (FET) Price Performance
With a $1.378 Billion market cap, the Fetch.AI token ranks at #64 in the crypto world. Further, it showcases a 22% drop in the last 30 days during the pullback phase.
TradingView
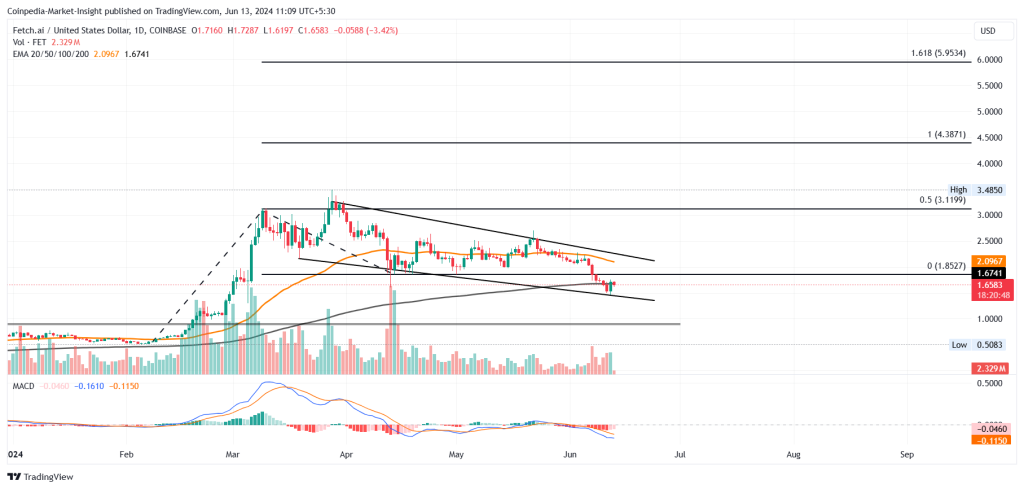
In the daily chart, the FET price action reveals a pullback trend, leading to a falling channel pattern. The bearish trend in the AI token falls under the $2 psychological mark and the 200D EMA with a downtick in the 50D EMA. Hence, the EMAs warn of a death cross in the daily chart.
Currently, the AI token trades at $1.63 with an intraday drop of 4.62% piercing into the 11.64% jump last night. Further, the last night forms a bullish engulfing candle from the support trendline. This peaks the possibility of a bullish reversal within the falling channel pattern.
Further, the MACD and signal lines in the daily chart prepare a bullish crossover bolstering the upcycle in the FET token price.
A bullish reversal within the pullback channel can result in a jump to the overhead resistance trendline. Hence the bull cycle can pump the FET price to the $2.5 mark.
Optimistically, the price reversal can result in a breakout rally to test the all time high close to $3.50.
Conversely, a bearish continuation can dump AI token under the $1.50 mark and the support trendline.


