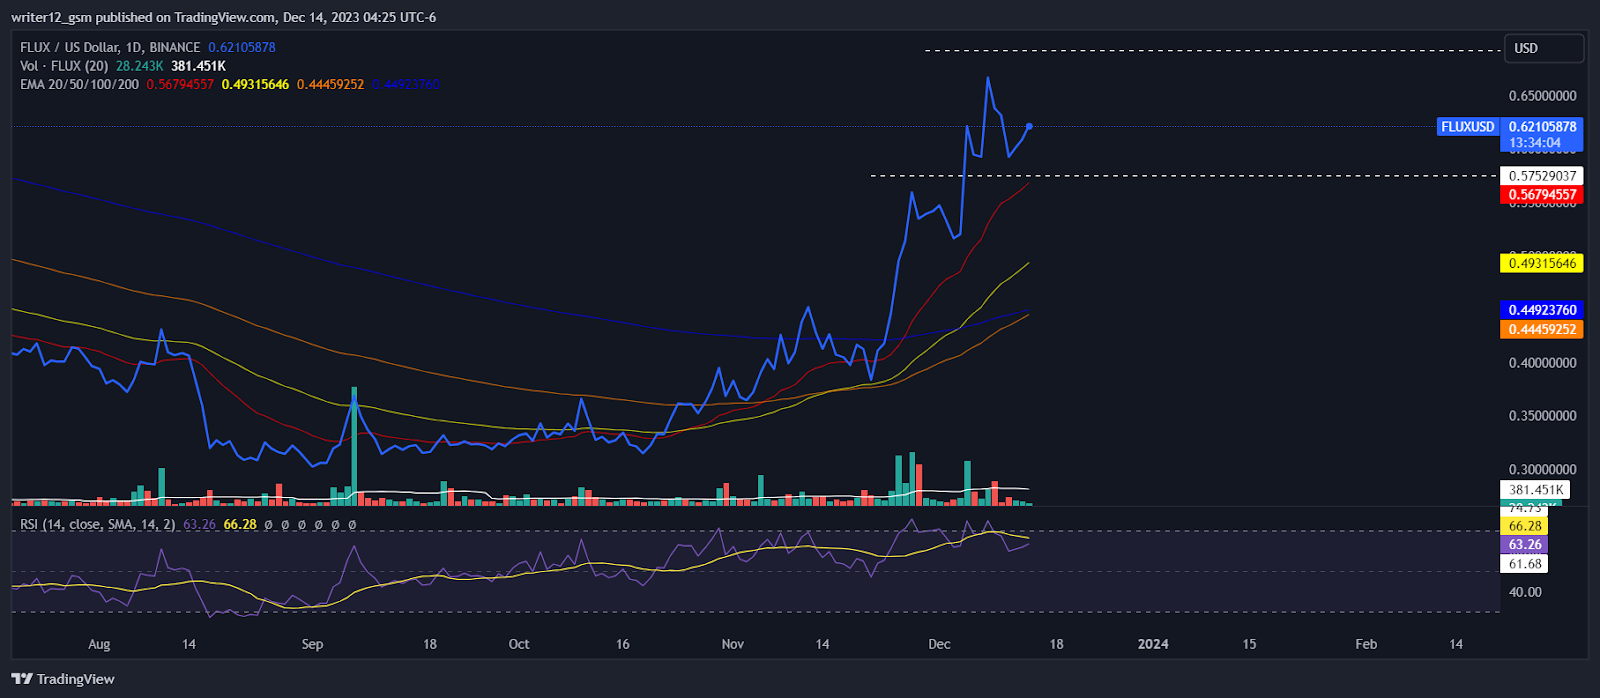
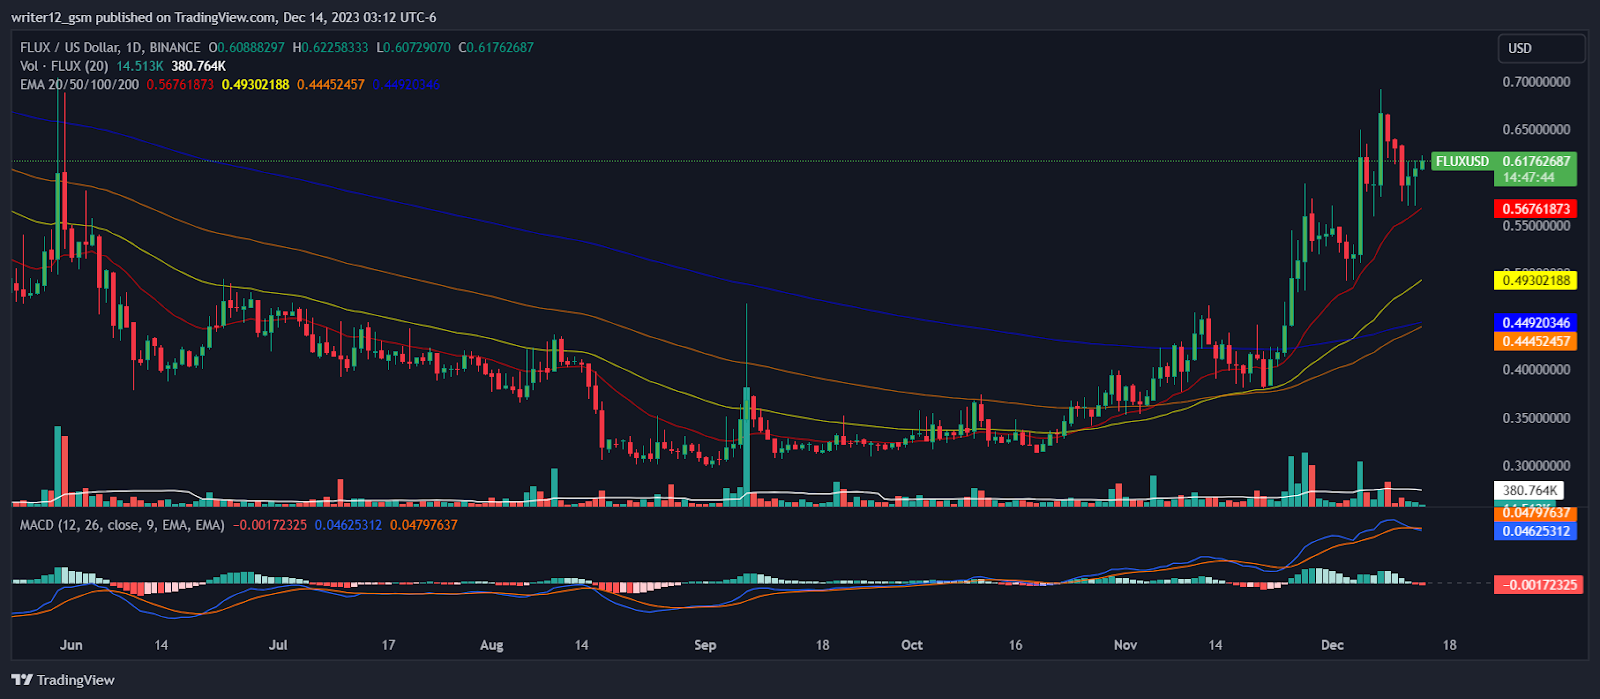
- 1 FLUX price is trading above the key moving averages, showing bullishness on the chart.
- 2 FLUXUSD price is making higher highs confirming the bullishness.
Flux crypto price is trading in a bullish zone making higher highs. Buyers overpowered the sellers in the last few sessions. The crypto price surged by 45.29% in the last month indicating remarkable bullish momentum.
At the time of writing the crypto price is trading at 0.62010716 with an intraday gain of 1.89%. The 24-hour trading volume is 10.797 Million with a market cap of 209.548 Million. Moreover, the market cap has increased by 6.88% and the volume decreased by 9.37% in the past 24 hours. The 24-hour high of the token is $0.6237 and $0.5779 was the low.
The performance of the coin throughout the year is a remarkable surge by 33.85% since the beginning of the year and by 52.18% in the span of 6 months. Furthermore, the token gave a good return of 94.14% in the 3 months, and last month it grew by 45.29%. The data shows the bullish momentum in the coin is maintained throughout the year.
Flux crypto is a digital asset that runs on its own native distributed ledger. This asset enables transactions, staking, and rewards within the Flux ecosystem. Flux is also the name of the wider project that encompasses the asset. The Flux platform is a decentralized computational network that offers infrastructure services such as hosting and storage, among others. It aims to allocate computational tasks across its network, harnessing the power of decentralized nodes to provide reliable, decentralized cloud computing.
FLUX Crypto Technical Analysis and Price Overview
Source: FLUX/USD Chart By TradingView
FLUX crypto price is trading above the key moving averages and surging high by making higher high structures. The price has recently bounced from the 20-moving average and showing bullish moves.
Technical indicator MACD is on the bullish side. The MACD curve at 0.04645098 and signal curve at 0.04645098 points show bullish moves. However, a bearish crossover has been seen indicating weakness.

Source: FLUX/USD Chart TradingView
The RSI curve is at 63.15 points and the 14-day SMA is at 66.27 points, trading near the overbought zone showcasing bullishness on the daily chart.
Conclusion
FLUX powers the Flux ecosystem, a decentralized network for Web3 development and DeFi access. The FLUX crypto price chart shows a strong bullish trend over the year, making higher highs and trading above the key moving averages. Technical indicators highlight bullish momentum, although a bearish crossover in the MACD could signal some weakness. FLUX has a strong support level at $0.5779 and a resistance level at $0.6237.
Technical Levels
Support Levels: $0.57529037
Resistance Levels: $0.69231673
Disclaimer
This article is for informational purposes only and does not provide any financial, investment, or other advice. The author or any people mentioned in this article are not responsible for any financial loss that may occur from investing in or trading. Please do your research before making any financial decisions
Anurag S
Anurag is working as a fundamental writer for The Coin Republic since 2021. He likes to exercise his curious muscles and research deep into a topic. Though he covers various aspects of the crypto industry, he is quite passionate about the Web3, NFTs, Gaming, and Metaverse, and envisions them as the future of the (digital) economy. A reader & writer at heart, he calls himself an “average guitar player” and a fun footballer.


