
With the meme coin sector making waves, the different sectors in the crypto world are gradually finding demand for a comeback this year. In a similar condition, the Metaverse tokens are starting to accelerate and tease a bull run at hand, teasing an altseason’s arrival.
With the anticipation of a bull market like 2021, the metaverse tokens are on the verge of massive gains this week. So, let’s have a look at the technical price charts of high-performing metaverse tokens like the High Street, Decentraland, and Gala to find out their possible bullish targets.
With a 50% surge within 5 days, the HIGH token price trend shows a massive surge in the bullish momentum. Further, the metaverse token shows a rounding bottom reversal in the weekly chart.
TradingView
The bull run in the metaverse token surpasses the 78.60% Fibonacci retracement level. This increases the possibility of a bull run for a new all-time high this week.
As per the Fibonacci levels, the breakout run can find resistance at the $7.260 mark. However, a breakout rally might push the token higher to the $11.225 mark, surpassing the $10 psychological mark in June.
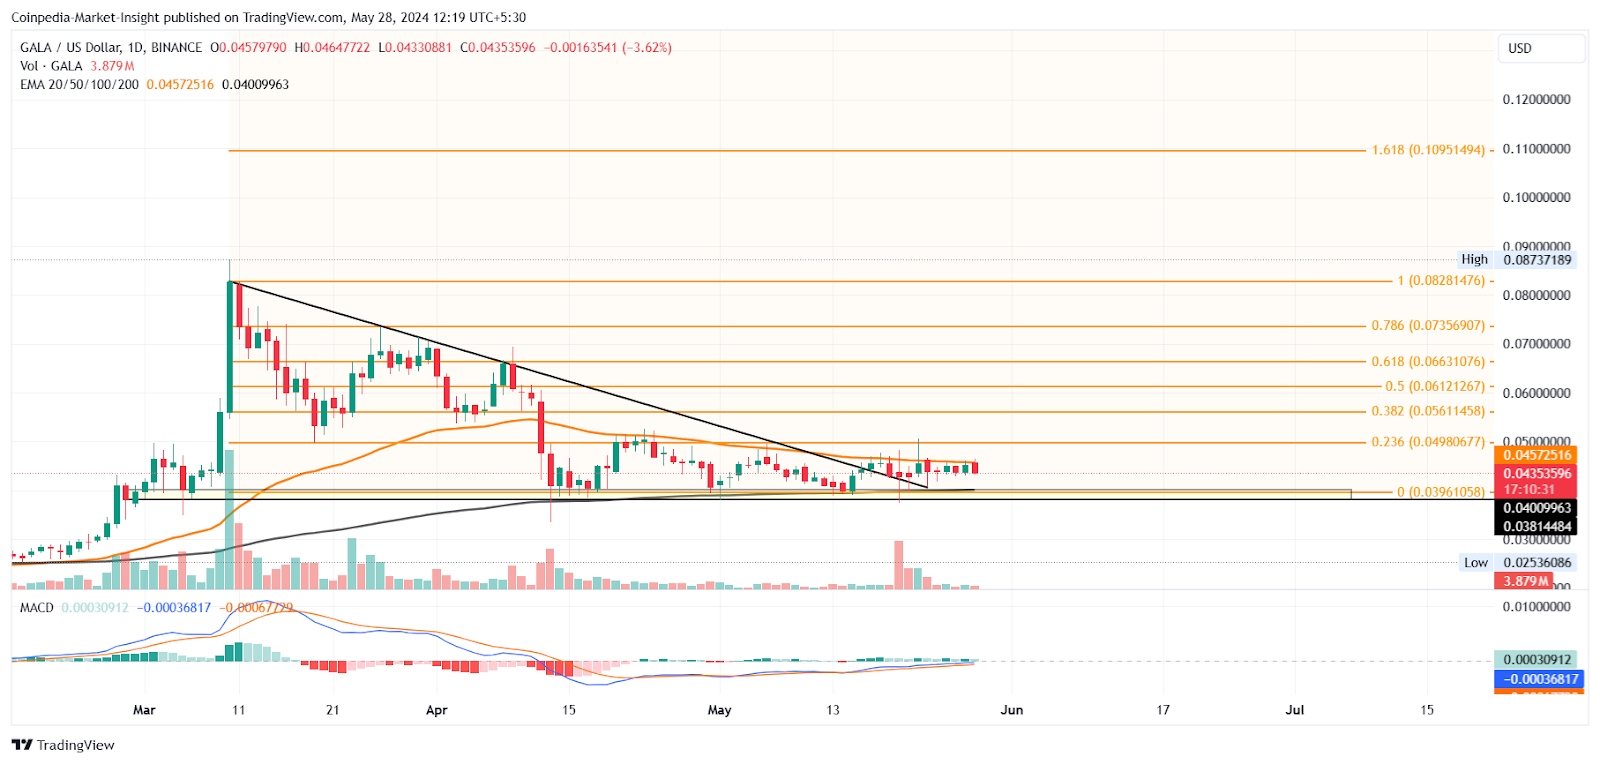
Trendline Breakout Gala Price Eyes 50% Surge
Amidst the broader market recovery, the sideways trend in the GALA token price projects a potential uptrend. The metaverse token shows a trendline breakout rally but struggles to gain momentum as it goes sideways under the 50D EMA.
TradingView
As the dynamic resistance 50D EMA declines, the possibility of a death cross increases. Further, the 3.82% intraday drop undermines the possibility of a trend reversal.
However, improving underlying sentiments could boost the metaverse token price to $0.061, which is the 50% Fib level.
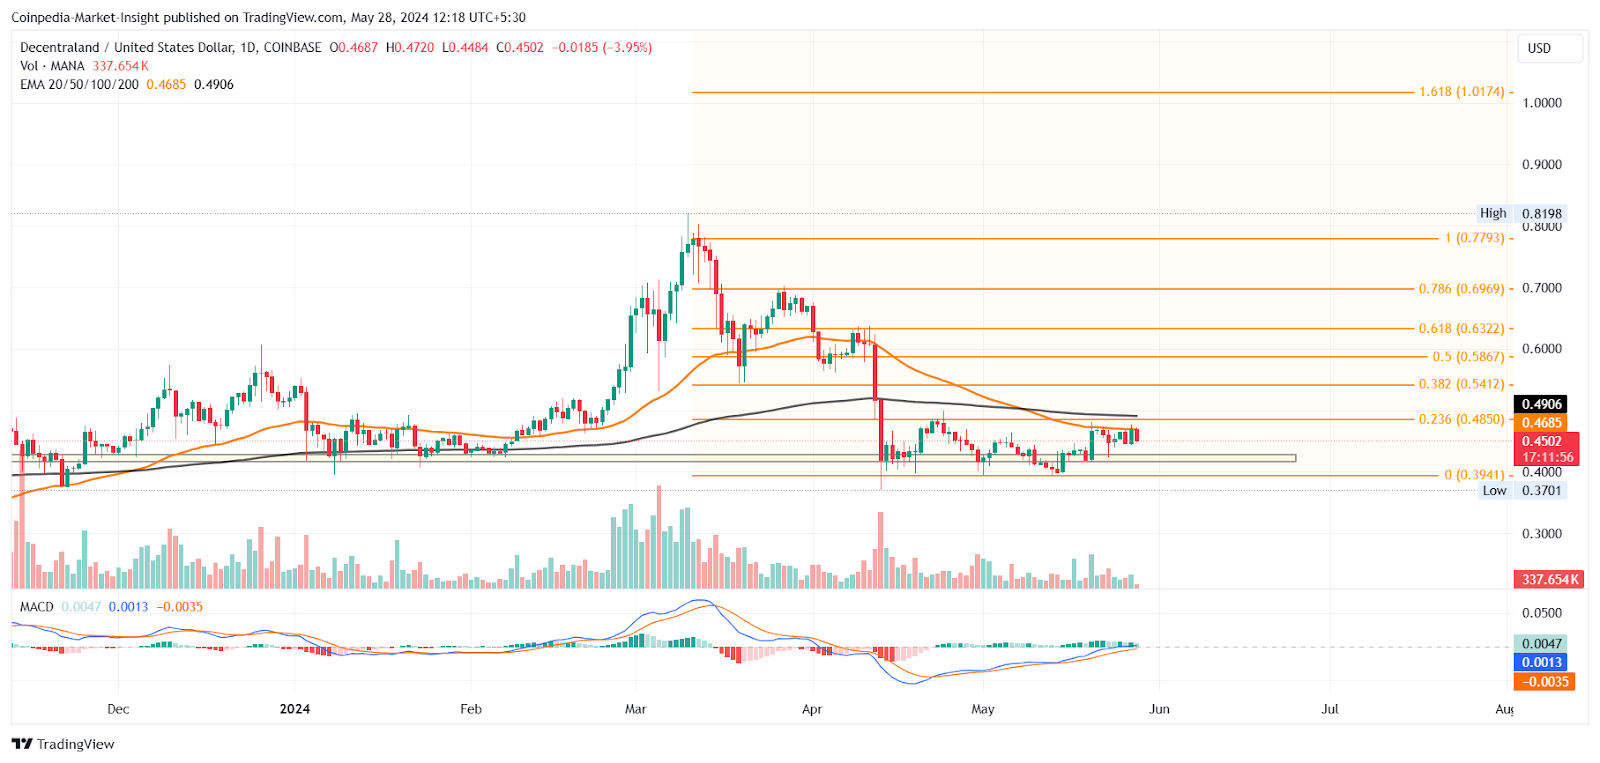
Will MANA Price Reverse The Death Cross?
Following a death cross in the daily chart, the MANA price shows a sideways trend under the 50D EMA. However, the recent surge from the $0.40 mark shows a bullish revival aiming for a trend reversal.
TradingView
Currently, the MANA price trades at $0.4481, with an intraday drop of 4.40%. However, the bullish trend in the MACD and signal lines bolsters the possibility of a bullish trend.
As per the Fibonacci levels, the MANA price could reach the $0.5867 mark or the 50% Fibonacci level if it surpasses the 23.60% level at $4850.