With the release of Mt. Gox Bitcoins, the broader crypto market has experienced a massive surge in supply pressure. As market analysts expect the supply to continue in the coming days, the crash could continue in the BTC and the altcoins price alike.
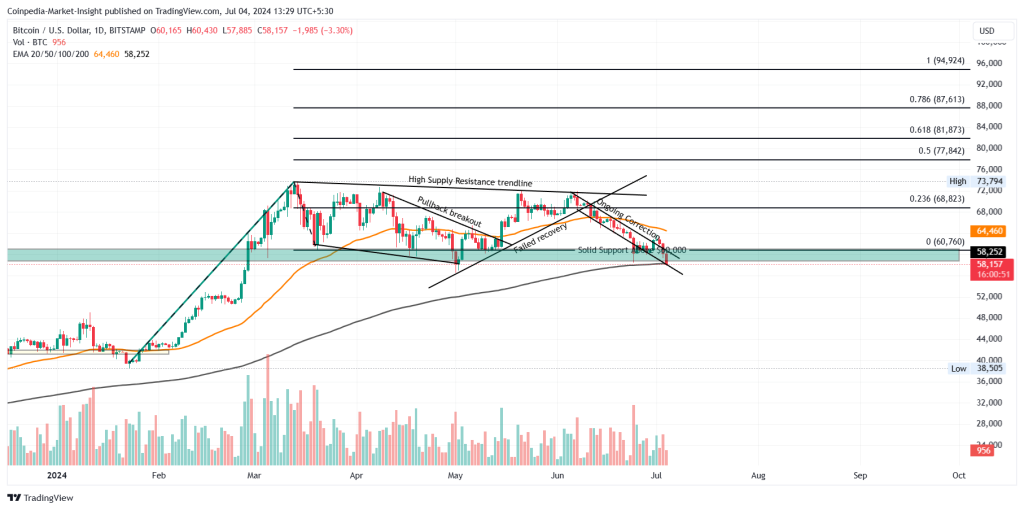
Crashing under the crucial support zone of $60,000, the BTC price trend marks the third consecutive bearish day. The downfall now tests the dynamic support of the 50D EMA and warns of another breakdown.
With the increasing supply, the long-liquidations are on the rise. Will the bearish trend result in a drop below the $56,000 level to test the psychological mark of $50,000?
Let’s examine our detailed price analysis for a clearer view of the BTC price trend. You can also check out our Bitcoin price prediction to determine the chances of Bitcoin hitting the $100,000 milestone this year.
Bitcoin Price Performance
With an ongoing correction, the BTC price is now down by 17% in the last 28 days to crash under the crucial $60,000 mark. The negative cycle within the flag pattern warns of a bearish reversal as the bottom support breaks down.
Tradingview
The declining price trend influences a downtick in the 50D EMA and warns of a death cross with the 200D EMA. Currently, the BTC price trades at $58,444 with an intraday drop of 2.81%, creating the third bearish candle to test the 200D EMA.
Bitcoin price action completes a triple black crow pattern and warns of a breakdown below the dynamic support. Further, the release of Mt.Gox payments accounts for massive long liquidations worth almost $80 million within 48 hours.
Will BTC Price Drop Under $56,000?
With increasing fear and supply in the crypto market, bearish anticipations are on the rise. Standing at the 200D EMA, the breakdown chances are significantly higher than that of a reversal as the trading volume surges 55% in 24 hours.
With the declining trend in motion, the next crucial supports for BTC price are at $56,000 and $52,000.


