Amidst the recovering altcoin market, the ORDI price action shows a bullish trend reversal after an intense pullback to $33. However, the recovery rally in ORDI experiences overhead resistance, leading to a contraction in volatility.
Will this contraction lead to a massive surge in the altcoin with a breakout rally? Will ORDI claim the $100 psychological milestone in 2024? Find out more in our ORDI price prediction.
Triangle Pattern Holds The Future of ORDI
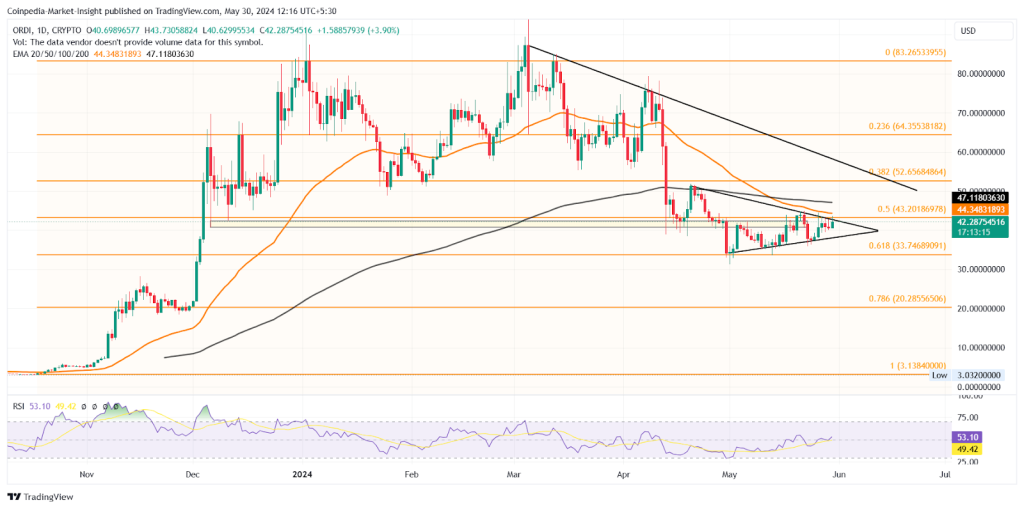
Following the bearish downfall to the $33 level, 61.80% Fibonacci level, from the $87 peak, accounts for a 62% drop. However, with the broader market recovery, the ORDI price trend siphons bullishness from the market to challenge the $43 mark.
Tradingview
However, the higher price rejection from an overhead resistance trendline leads to a triangle pattern. Currently, the recovery rally is up against the resistance trendline and the 50% Fibonacci level at $43.
Currently, the ORDI price trades at $41.96 with an intraday gain of 3.03%, leading to another bullish candle. This recovery rally increases the possibility of a breakout rally to reclaim the $50 psychological mark.
Technical indicators:
RSI Indicator: With a contraction in volatility, the daily RSI line turns sideways near the halfway line.
EMA: The death cross in the 50D and 200D EMA reflects a bearish reversal. Further, the 50D EMA provides a dynamic resistance to bullish attempts.
Will ORDI Price Break The Triangle?
Despite several bearish oppositions, the broader market recovery and the breakout possibility could lead to a bull run in ORDI price. As per the Fibonacci retracement levels, the altcoin price could reach the 78.20% level at $64.
Conversely, a downfall under the support trendline will put additional pressure and risk the $33 breakdown. In such a case, the next support level is at $20.


