
With a plunge of 7.82% within the past 24 hours, the cryptocurrency market has lost its $2 Trillion mark and is currently valued at $1.98 Trillion with a 24-hour trading volume of $116.88 Billion. Further, the price of Bitcoin has recorded a low of $53,717.38, the lowest since February this year.
Following this, the memecoin category has displayed a strong bearish price action with top tokens recording a correction of over 15% each in their respective portfolios. With the rising bearish sentiment, will memecoins make a comeback this month?
Pepe (PEPE) Price Analysis:
The Pepe price has recorded a correction of 16.84% within the past 24 hours and 36.02% over the past seven days. Further, the memecoin has plunged 46.74% in valuation over the past 30 days, highlighting a rising bearish sentiment in the crypto space.
The Moving Average Convergence Divergence (MACD) displays a constant rise in the red histogram, indicating an increase in the selling-over-buying pressure in the crypto space. Moreover, the averages show a negative trend, suggesting the PEPE price will continue losing momentum.
Moreover, the RSI indicator has failed to surpass its mid-point in the 1D time frame. This has resulted in it recording a sharp plunge toward the oversold range.
If the bulls regain momentum, the Pepe memecoin will prepare to test its upper resistance level of $0.00001150. Conversely, if the bears continue to dominate the market, the Pepe token will plunge toward its low of $0.00000625 in the coming time.
Meme Ai (MEMEAI) Price Analysis:
Amid the ongoing market correction, the Meme Ai price has recorded a correction of 12.89% within the past day and 14.92% over the past seven days. Moreover, it has plunged 53.63% over the past 30 days, highlighting a negative outlook for this memecoin in the coming time.
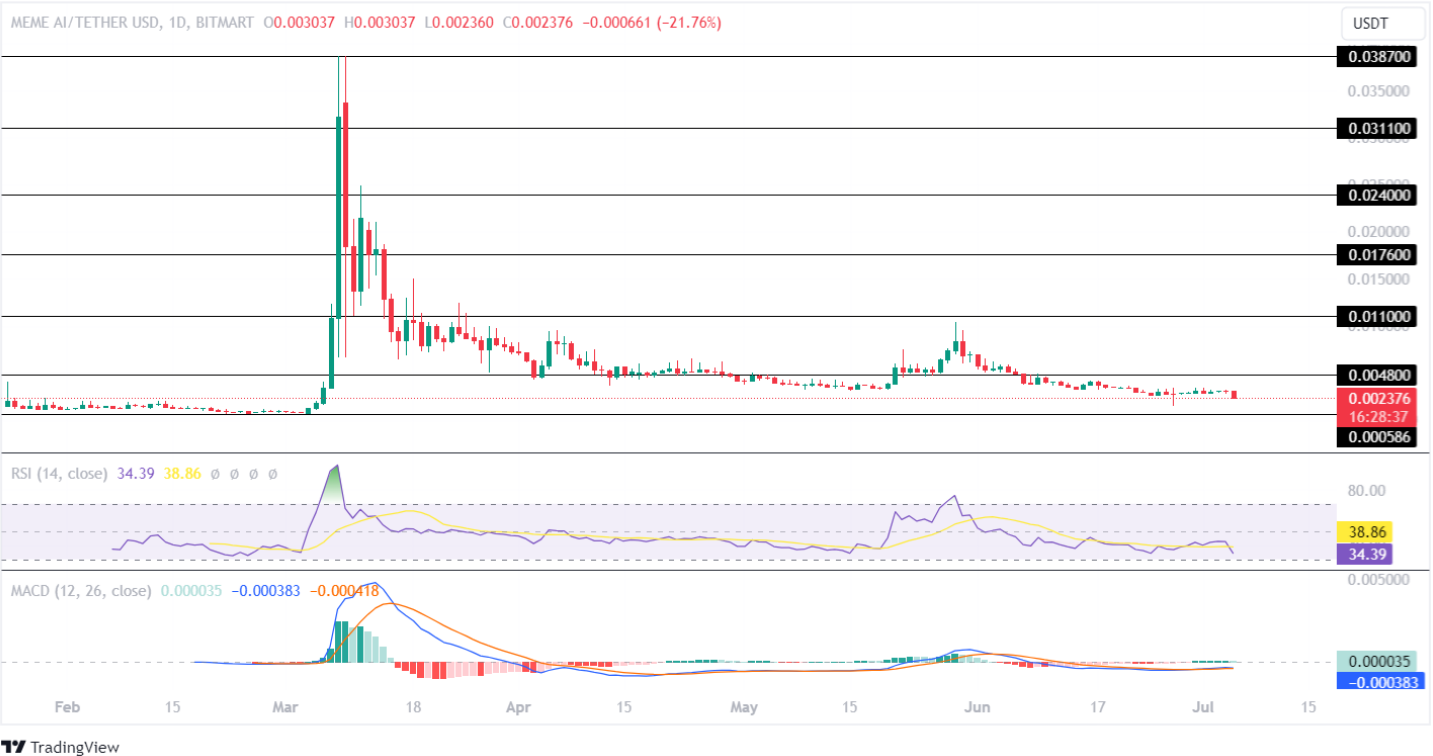
The Relative Strength Index (RSI) has recorded a sharp decline in its chart, suggesting an increase in the bearish sentiment for the memecoin in the cryptocurrency market. Further, the average trendline shows a negative crossover, suggesting the MEME price will continue losing momentum.
On the other hand, the MACD displays a constant flatline in its price chart, suggesting a weak price action. Moreover, the average records a neutral trend, highlighting uncertainty in the future price action of this memecoin.
If the market regains momentum, the MEME AI price will head toward its upper resistance level of $0.0048 during the upcoming weeks. However, if the bears overpowered the bulls, the memecoin would drop toward its crucial support level of $0.000586.


