Celestia is the world’s first modular blockchain that helps build new blockchain services and is on the green side today. TIA Coin price had an impulse surge of 17% in the past 24 hours with the price at the time of writing sitting at $11.39. Accompanied by the massive volume rise of 232%, bringing marketcap 2.1 billion ( 15% up).
This bullish price action is due to 3 possible scenarios. A 31% surge was seen in TIA’s total open interest from $110.3 million to $157.71 million in just 24 hours. This reveals the increased buying interest among investors, leading to increased liquidity.
Also, TIA experienced a surge in’ The total funding rate’ from 0.005% to 0.011% in 24 hours, as traders are willing to pay a premium to maintain their long positions.
Additionally, a report from Santimented reveals that over 80% of the uptick was seen in social media conversations about TIA, resulting in increased hype and investor confidence.
TIA Slowed Down The Uptrend
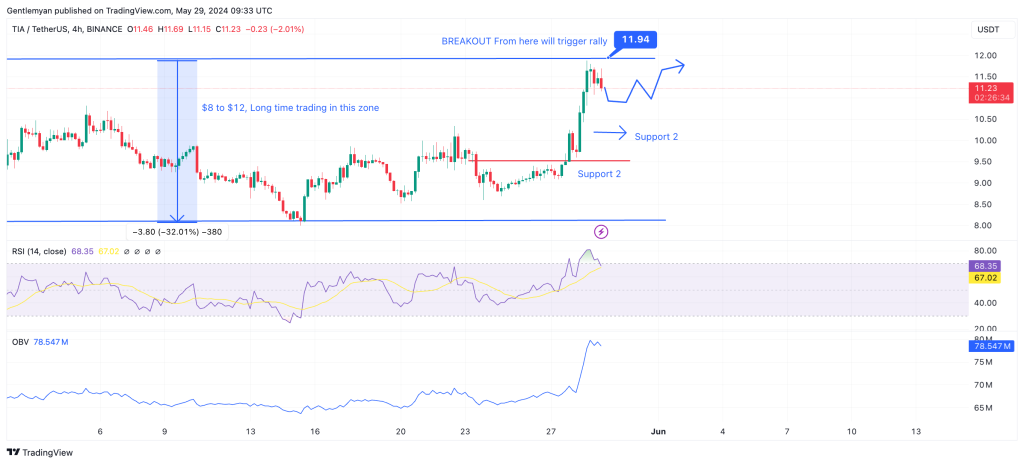
Celestia price rally triggered a bullish wave among investors resulting in high volatility and increased accumulation. But, the price faced rejection again to move above $12, which is a long-time resistance zone for TIA.
After falling from its ATH of $21.61 on Feb 10, Celestia has made swings with a downtrend but maintained a range between $8 to $12 since April. TIA Price action is not breaking the zone of $8 to $12 despite different market trends is a concern for investors.
Techichals and Indicators are all Bulish for TIA
All the Indicators and Technicals for TIA have a bullish trend for TIA as long as the price is maintained above the support level of $10.11. The first target to break resistance at $11.11 was achieved, and the next resistance breakout buyers target is at $11.94 or $12.
The price is moving above all the moving averages in SMA and EMA and RSI at 68 is holding the volatility. The On balance volume (OBV) Indicator shows a short dip in volume, indicating distribution happening near $12.
On the other Bitcoin is struggling to reclaim the $70,000 mark, on doing so altcoin dynamics will also be changed. If that happens, Celestia (TIA) wll break above $12, and that wil influence an upward rally toward $13.5 and $15 resistance levels.
Traders must closely watch $11.94 to enter the trade and wait at the $10.19 zone, if a break out below this happens it may lead to painting more red candles.
The Current fundamentals and Technichals show a strong bullish trend accompanied by short corrections.


