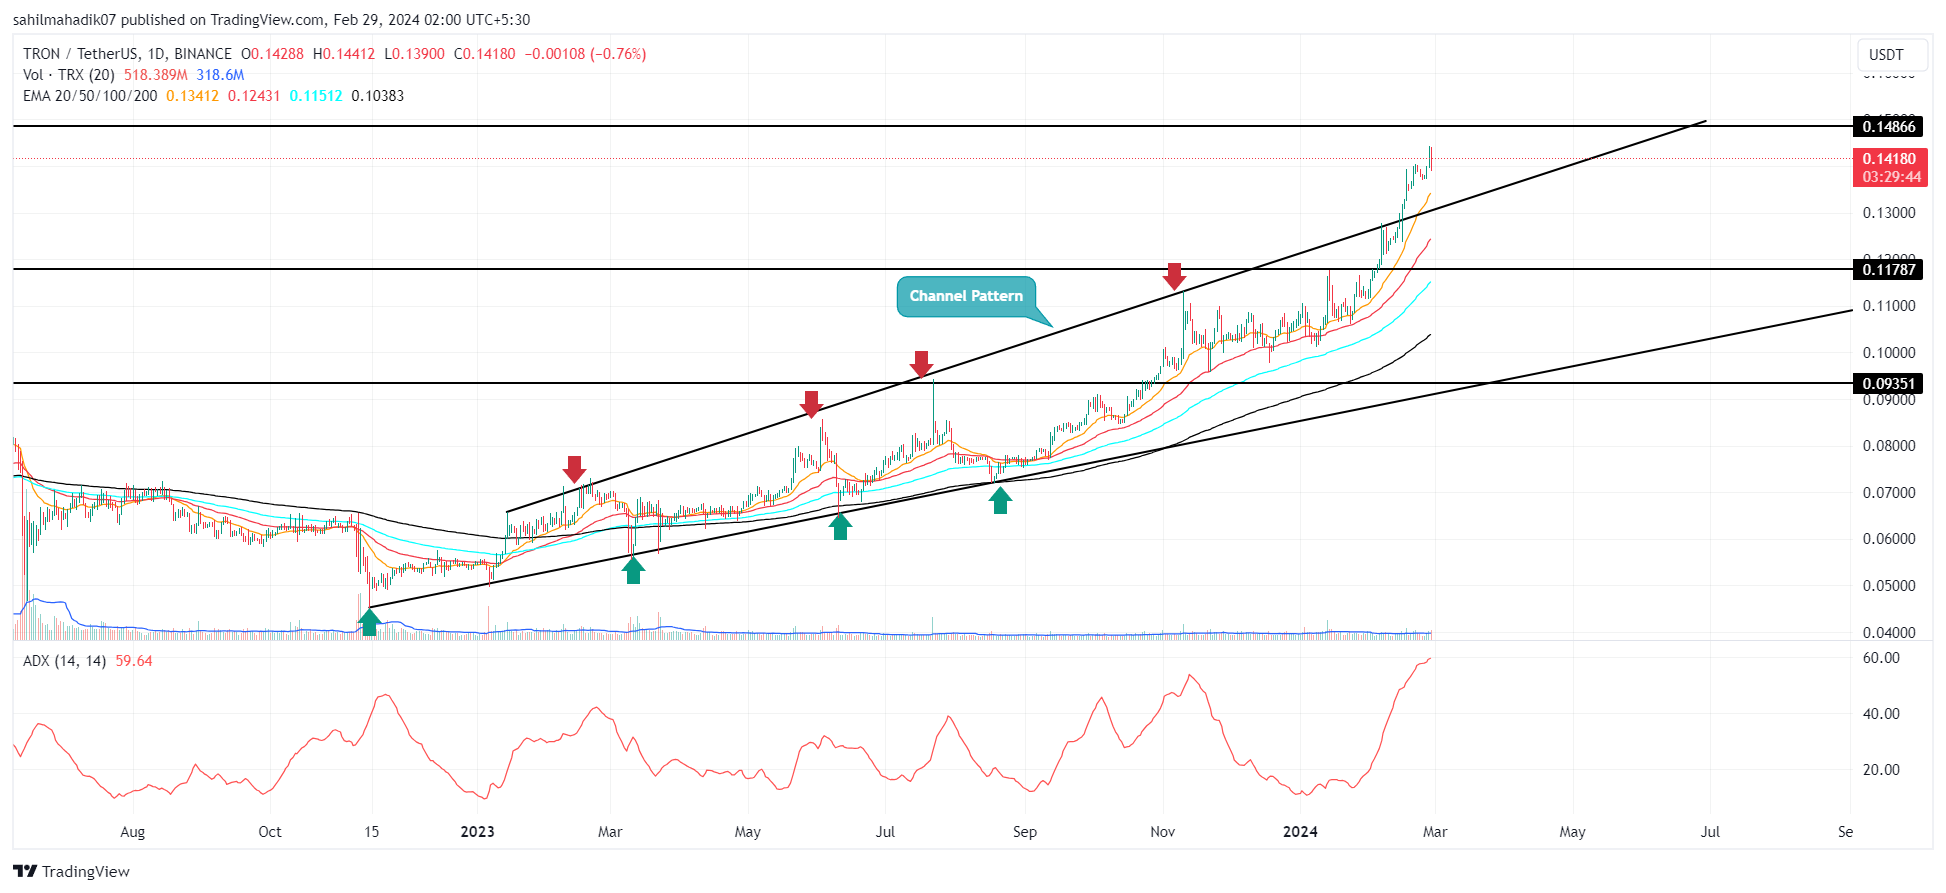
Throughout February, the TRON coin has witnessed a slow yet consistent recovery which uplifted its price from $0.111 to $0.14 to register 26% growth. This bullish upswing backed sufficient volume, and broader market sentiment indicates sustainable growth which recently breached the resistance trendline of the channel pattern. Will the breakout intensify the recovery momentum for a rally beyond $1.5?
Is TRX Price Ready to Regain $0.15?
TRON Price| Tradingview
In the daily time frame chart, the ongoing recovery in Tron coin price can be traced using a rising channel pattern. The two ascending trendlines of this pattern have guided the TRX price with dynamic resistance and support since November 2022.
The bull rally surged the coin value from $0.045 to $0.142 to a record 214% in the last 15 months. Moreover, a cryptocurrency analytics firm IntoTheBlock, has recently highlighted that the TRON network has surpassed a milestone of over 95 million addresses with balance.
This is a particularly impressive figure when compared to other prominent Layer 1 blockchain networks such as Cardano and Avalanche, which have fewer than 10 million addresses each. The steady increase in TRON’s network addresses is a testament to the growth and expansion that TRON DAO is driving.
There are more than 95 million TRON network addresses! Quite an impressive number, considering other layer 1 networks like Cardano and Avalanche have fewer than 10 million addresses. The consistent growth in addresses highlights the growth @trondao is fostering. pic.twitter.com/N7dZqobRlz
— IntoTheBlock (@intotheblock) February 28, 2024
With the recent price surge, the TRX Price breached the resistance trendline of the aforementioned channel, indicating the buyers preparing for a higher jump. Currently trading at $0.14, if the coin price is sustained above the breached trendline around $0.135, the buyers will gain momentum to chase a $0.18 high.
Having said that, the TRON coin is poised for a minor pullback to recuperate the exhausted buying pressure, the anticipated pullback may offer buyers a potential pullback opportunity at the support next $0.135.
Technical Indicator:
- Average Directional Index: The ADX slope at 59% indicates the buyers are carrying an exhausted rally which will need a notable retracement to sustain a long run.
- Exponential Moving Average: The fasting moving 20-and-50-day EMA moving average may continue to provide suitable pullbacks.


