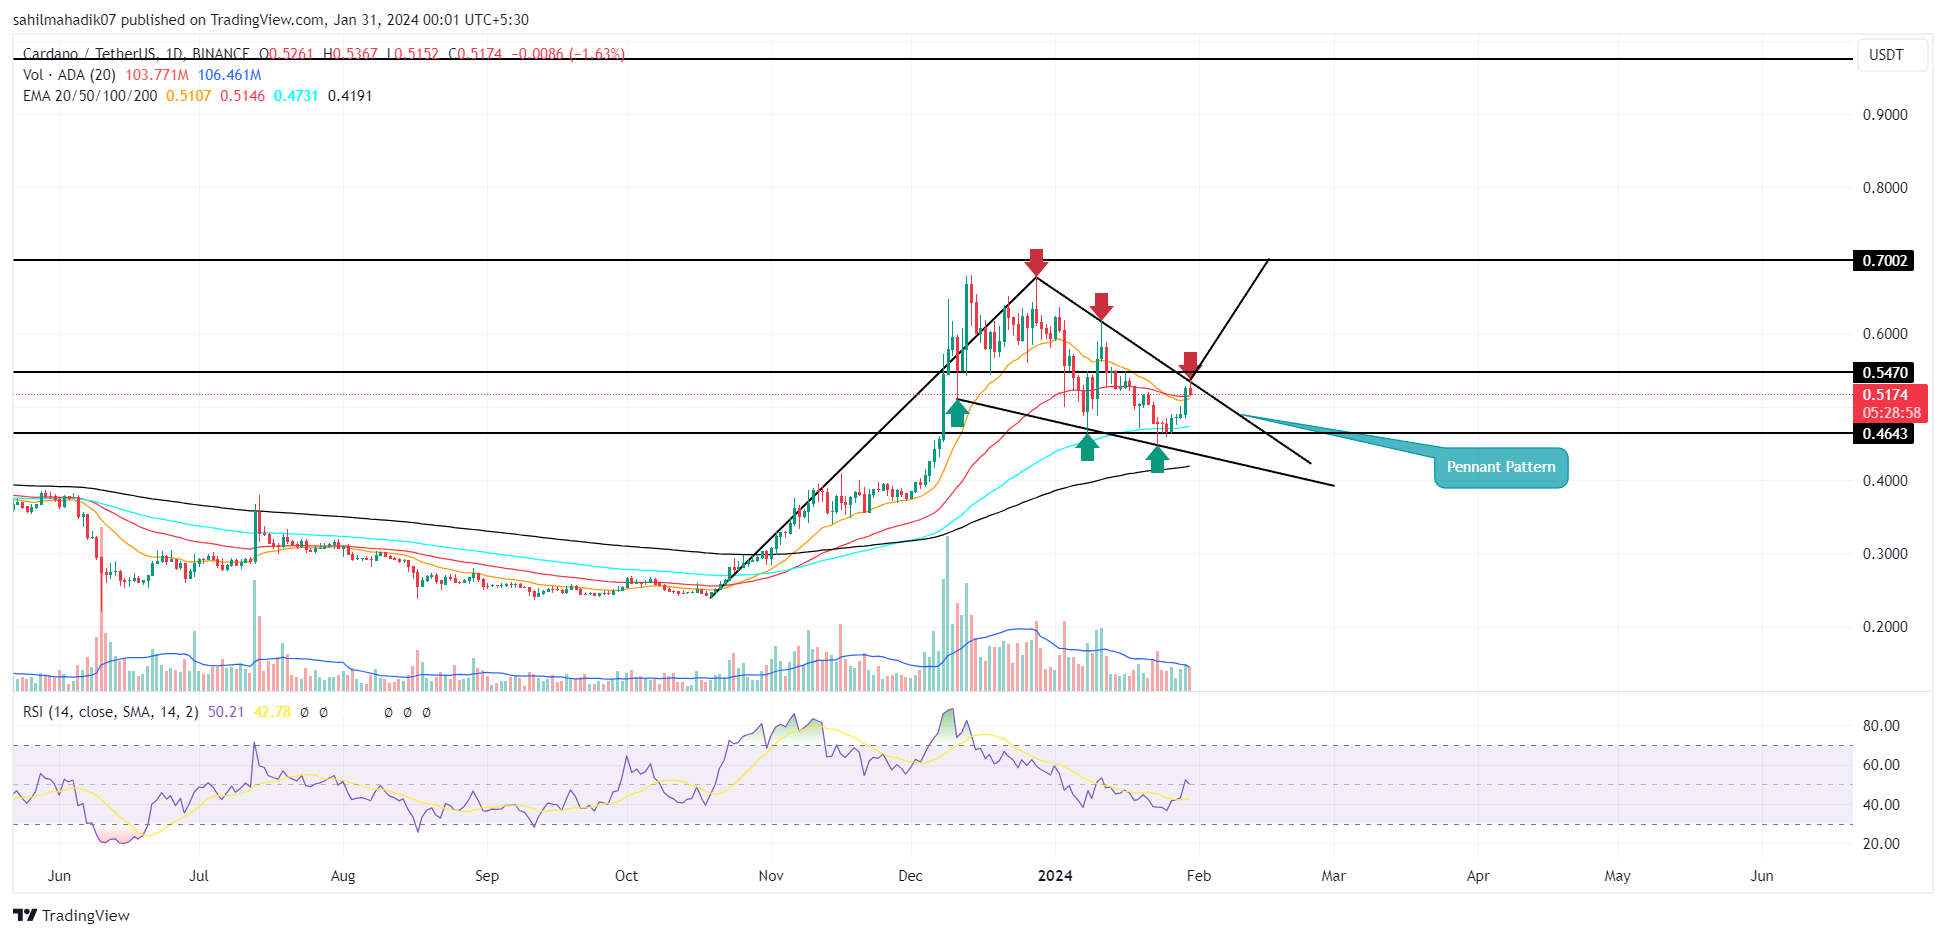
In sync with the recent uptick in the broader cryptocurrency market, Cardano Price has seen a notable rebound from the $0.46 level. This positive turnaround from the local support has resulted in a 12% increase in ADA’s value over the past five days, bringing its current trading price to approximately $0.519. However, this upward trajectory is encountering resistance at the trendline of the pennant pattern, which poses a risk of a prolonged correction if ADA is unable to break through this resistance level.
Last Pullback Before ADA Surpass $0.7 Mark
- The ADA coin rebounded thrice from each side of the converging trendline indicating the pennant pattern has a strong influence on price movement
- A price retracement of 50% projects the buyers continue to have a strong grip over this asset.
- The intraday trading volume in the ADA coin is $552 Million, indicating a 61% gain
Cardano Price| TradingView Chart
ADA, the primary cryptocurrency of the Cardano ecosystem, has been experiencing a downward trend for the past month, with its value decreasing from $0.677 to the current trading level of $0.51, marking a 23% decline.
Analysis of the daily chart suggests that this correction is following a structured pattern within two converging trendlines, characteristic of a pennant pattern. This pattern is often seen in technical analysis as a consolidation phase following a strong rally, offering a period for buyers to consolidate and prepare for a potential upward movement.
Should the price successfully break through the upper boundary of this pattern, it could provide a strong foundation for buyers to resume the upward trend.
Following such a breakout, ADA can target higher price points, initially aiming for $0.7, and then potentially advancing towards $0.975.
Conversely, the recent drop in ADA’s price from the upper trendline, by 1.35%, suggests that sellers are still exerting pressure at higher levels. If this trend continues, ADA could face a further 18% decline, potentially reaching the lower trendline at around $0.42.
Technical Indicator:
- Relative Strength Index: The daily RSI slope at 50% reflects the market sentiment neutral on this asset
- Exponential Moving Average: The coin price trading above the 100-and-200-day EMA indicates the long-term trend remains bullish.
Related Articles:
- Cardano Price Prediction: Bulls Poised for New Rally, Will ADA Defy The Odds?
- 3 Best Altcoins To Buy Today 30 Jan: SEI, LINK, DOGE
- Fed Rate Cuts Possible In March Before Bitcoin Halving, Will BTC Price Rally?


