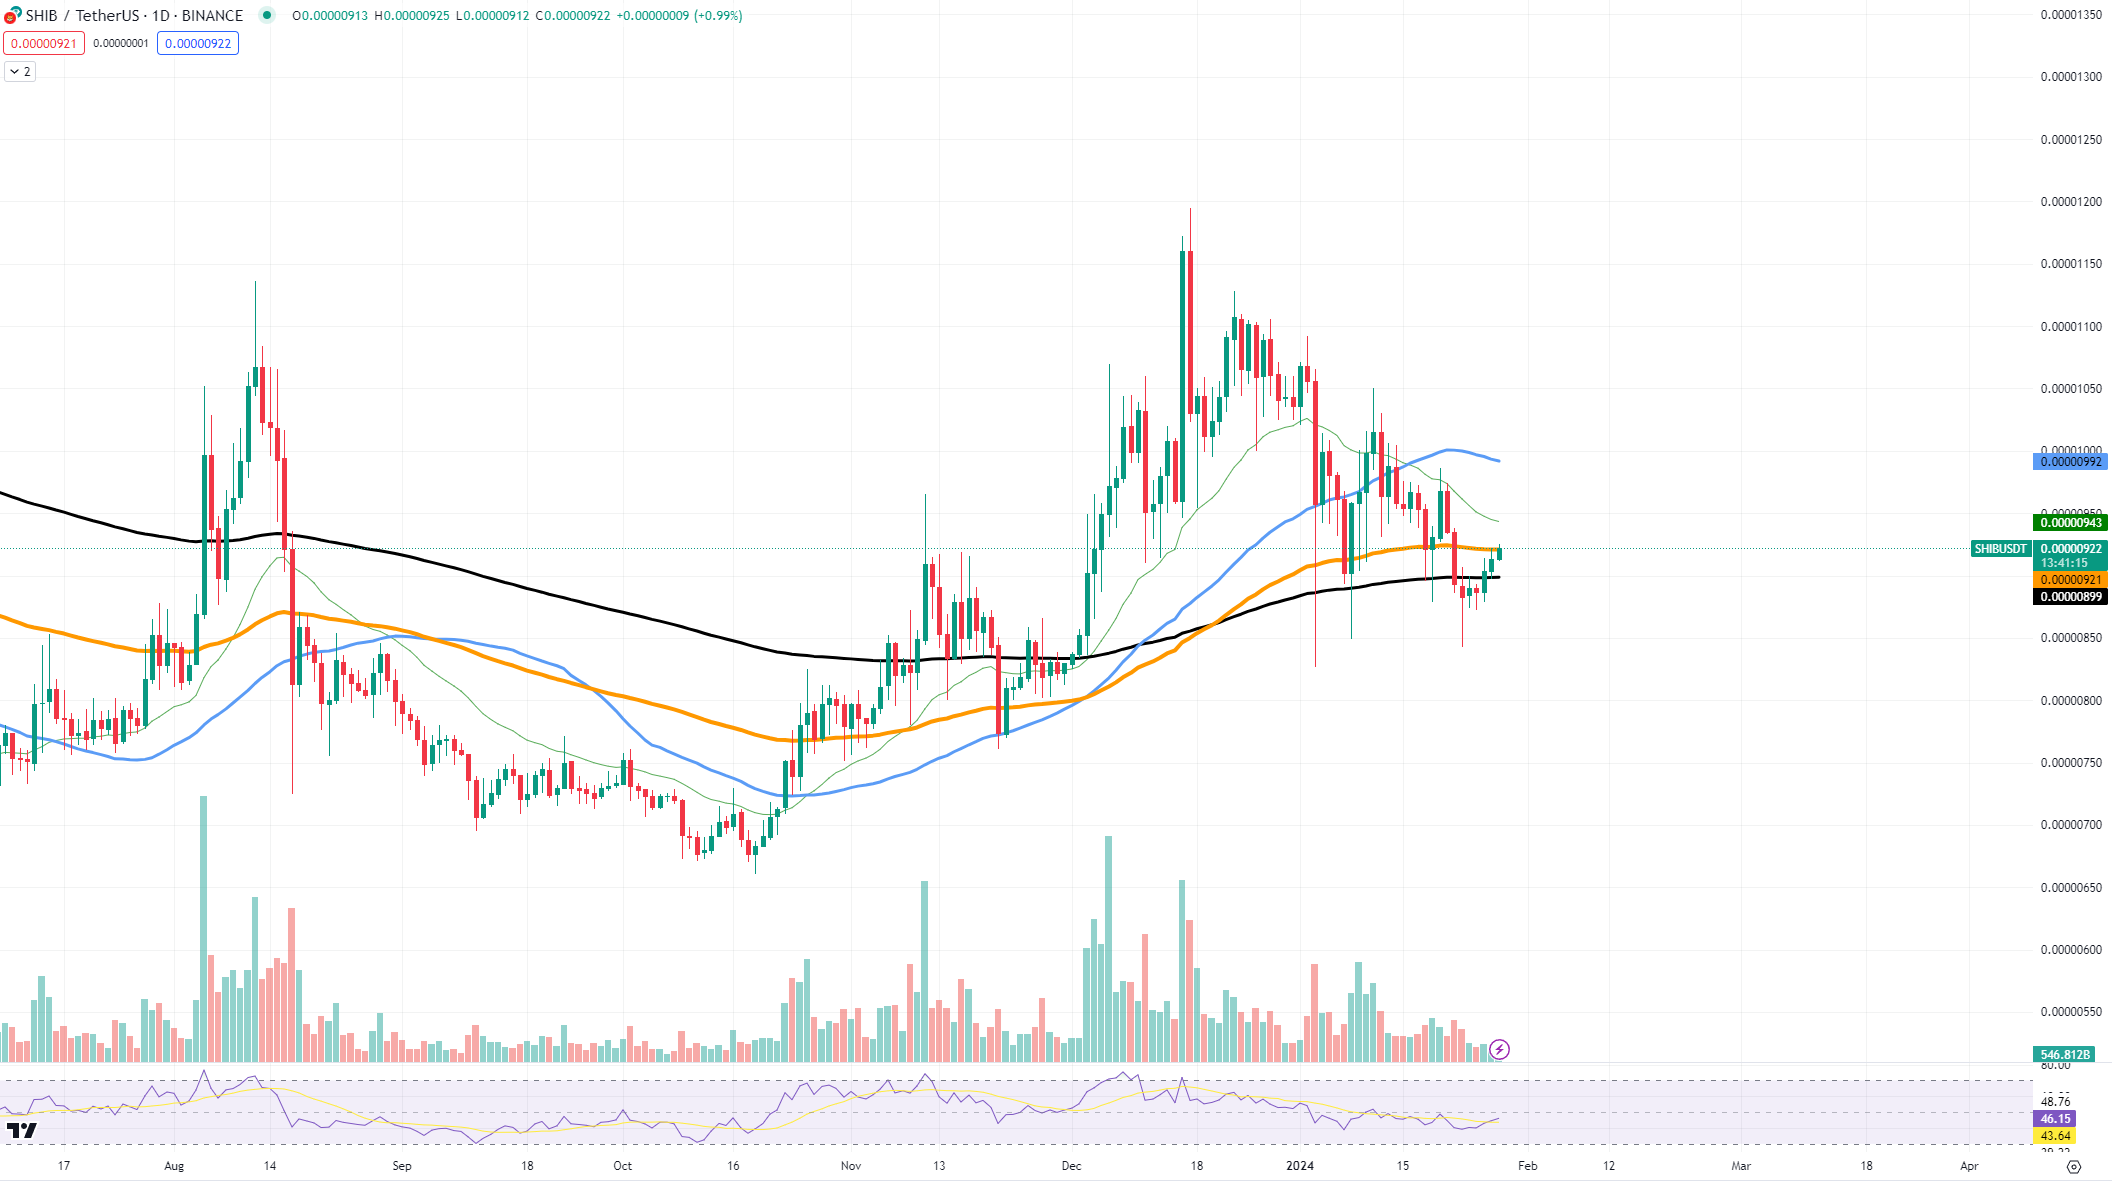
Shiba Inu’s price is currently hovering around a significant threshold. The asset has been trading below the 50-day moving average, which has been acting as a dynamic resistance level. The 100-day MA is currently being tested as support, with SHIB prices fluctuating around this line.
However, SHIB’s price is also exhibiting weaknesses. The trading volume has been relatively low, indicating a lack of decisive movement that could either confirm a breakout or a breakdown.
The RSI sits at a neutral level, suggesting there is room for movement in either direction without the asset being immediately overbought or oversold. This indecision in the market could lead to a period of consolidation before any significant price changes occur.
For reversal possibilities, traders should watch the key resistance level at the 50-day MA, which, if breached, could signal a shift in trend toward bullish momentum. Conversely, the 100-day MA support is crucial; a sustained break below could hint at a bearish outlook with potential support near the lower Bollinger Band.
Support and resistance levels are clearly demarcated on the chart. Immediate support is at the 0.00000914 USDT level, followed by a stronger historical support at 0.00000880 USDT. On the flip side, immediate resistance lies near the 0.00000950 USDT level, with further resistance at 0.00001000 USDT.
The burn rate of SHIB tokens has skyrocketed by nearly 5,000%, the uptick in network activity and the aggressive burn rate are positive signals for the SHIB ecosystem, suggesting growing activity on the network.
XRP stays under pressure
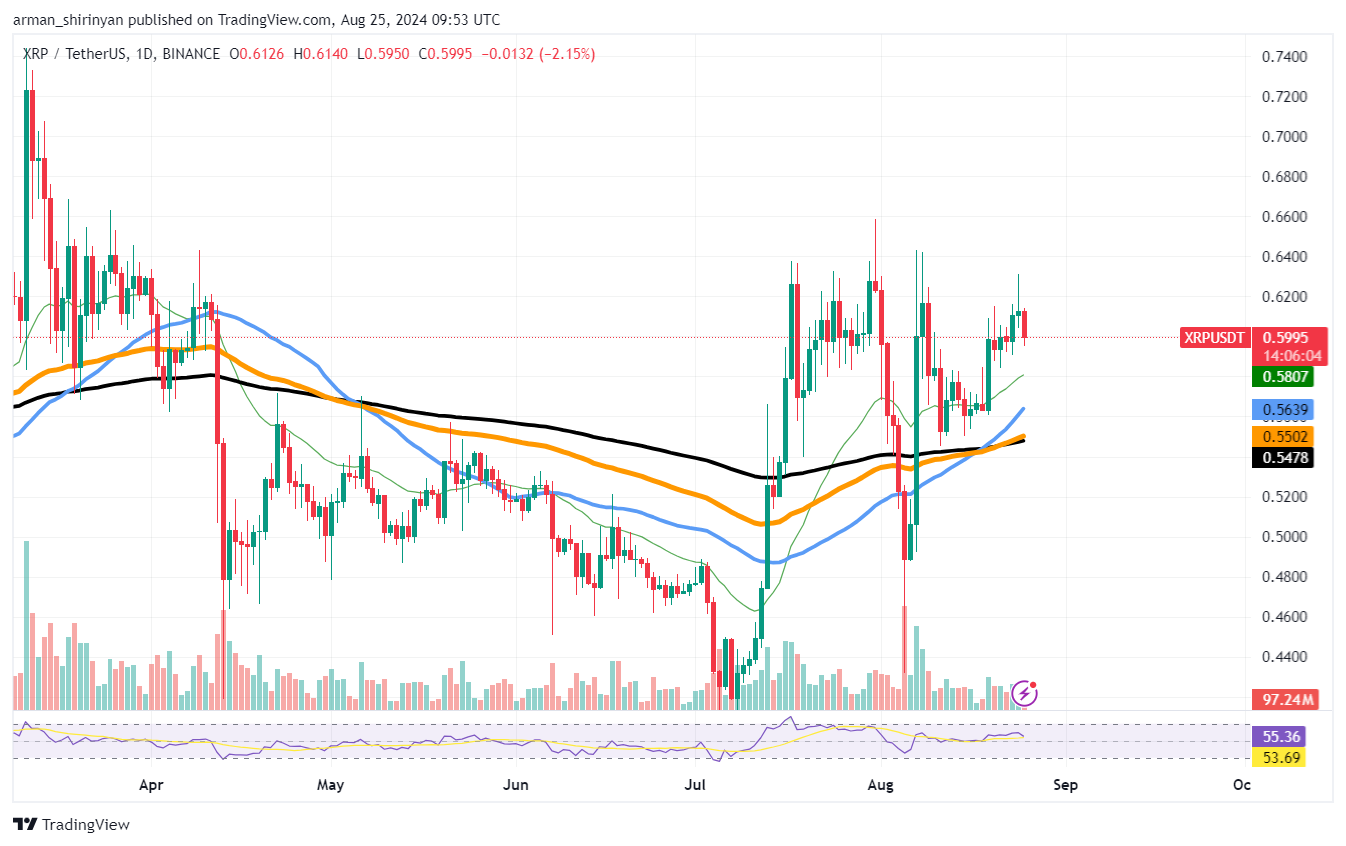
The XRP market presents a challenging picture, with its price action trapped within a descending channel that underscores the selling pressure the asset is facing. The bearish sentiment in the chart is clear, with XRP struggling to find bullish momentum.
As of now, we can identify two resistance levels that are key to determining XRP’s short-term trajectory. The first resistance level is at approximately $0.5597, which is in line with the 50-day moving average, and the second resistance lies at the $0.5898 price level, near the upper boundary of the descending channel.
A scenario for growth would involve XRP breaking above these resistance levels, signaling a potential reversal of the downtrend. For such growth to become rapid and sustainable, there would need to be a confluence of positive market sentiment, increased utility or adoption of XRP.
Cardano’s strong start
Cardano has recently shown a glimmer of resilience, bouncing off the 100-day EMA, a hopeful sign for investors. However, optimism should be cautiously tempered, as it may be too early to declare this the start of a sustained growth period for the cryptocurrency.
At present, Cardano is trading just above the 100-day EMA, which is serving as a critical support level. This support is notably located at around $0.4717. The bounce from this level is indeed a positive sign; however, the path to a bullish reversal is fraught with significant hurdles.
The immediate resistance Cardano faces is at the 50-day EMA, which stands around the $0.5155 mark. This level has historically acted as a stiff resistance, and a breakthrough would be necessary to confirm the beginning of a bullish trend.
The possibility of a prolonged market reversal exists, but for ADA to truly showcase a change in trend, it will need to break above the 50-day EMA convincingly and sustain that break. This would require not only technical strength but also support from broader market sentiment, which currently remains tepid amid regulatory concerns and economic uncertainties.
In terms of the most likely scenario for Cardano in the foreseeable future, the asset may continue to experience sideways trading within these EMA boundaries. The key would be for ADA to maintain its footing above the 100-day EMA and for buyers to gather enough momentum to challenge the 50-day EMA. Should it succeed, ADA could target the next resistance level at $0.5612, which aligns with a recent consolidation area.


