Ethereum Price: ETH, the second-largest cryptocurrency, experienced significant volatility this week, reflecting the consolidation of Bitcoin prices below $38,000. This sideways movement led to a decrease in bullish momentum across the crypto market, hindering the progress of most major cryptocurrencies.
Despite this, with the Bitcoin price stabilizing above $30,600, ETH witnessed a resurgence in buying interest. This surge pushed ETH’s price beyond the psychological barrier of $3,000. Is this breakout a signal to enter the market?
Is ETH Price Ready to Gain $3500?
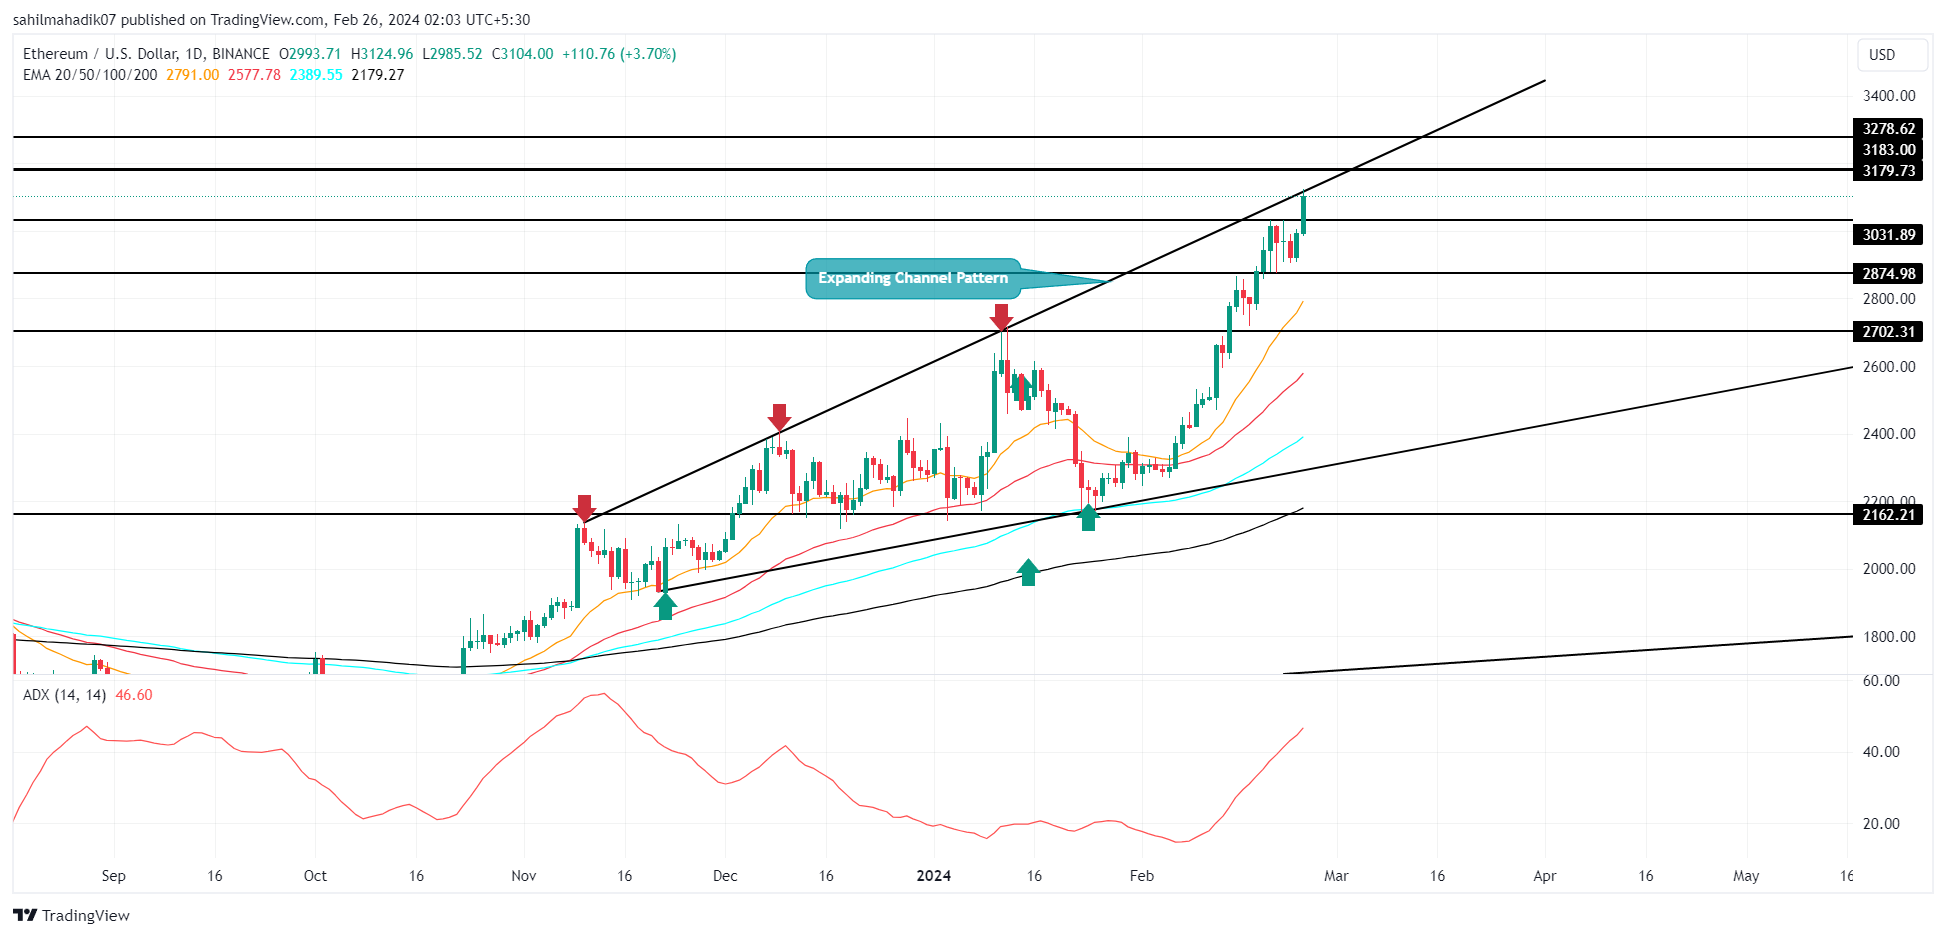
Ethereum Price| Tradingview
The Ethereum (ETH) coin initiated its current recovery trendline in late January when the price showcased sustainability above $2166. This upswing recorded 41% over the past five weeks and reached the current trading price of $3062.
The recovery was spared in response to the Bitcoin price rally, following the massive inflow of funds into the spot BTC ETG. The bull run gained further momentum as the Ethereum network steadily progressed to its much-awaited Dencun upgrade scheduled for implementation at slot 8626176 around mid-March.
This week, the Ethereum price traded majorly sideways resonating between the two horizontal levels of $3030 and $2875. Following an aggressive rally, the recent consolidation must have asserted the ETH price to recuperate strength.
With an intraday gain of 3%, the altcoin gave a decisive breakout from the range’s resistance and reclaimed the psychological level of $3000. If the coin price shows sustainability above the reclaimed level, the buyers may aim for a potential target of $3180, followed by $3280.
Channel Pattern Puts Ethereum Price at Risk of New Correction
While the current market outlook for Ethereum seems bullish, a look at the daily chart shows the ongoing rally is strictly following the structure of an expanding channel pattern. With the coin price close to the pattern upper trendline at $3180, the ETH price may face intense supply to trigger a new correction.
Technical Indicator
- Exponential Moving Average (EMA): A bullish crossover state between the daily EMAs(20, 50, 100, and 200) indicates a strong uptrend in action.
- Average Directional Index: The ADX slope at a high of 41% indicates the buyers may soon hit exhaustion and need a minor pull to recuperate strength.

