
The BONK price has decreased significantly since its all-time high on December 15, 2023.
Despite the decrease, BONK broke out from a short-term descending resistance trend line today.
BONK Falls After Parabolic Increase
The technical analysis from the daily time frame shows that the BONK price has increased swiftly since October. The upward movement led to a high of $0.0000350 on December 15. This amounted to an increase of 20,000% in two months.
The price has fallen since, culminating with a low of $0.0000093 yesterday.
Technical analysts employ the Elliott Wave theory to identify recurring long-term price patterns and investor psychology, which helps them determine the direction of a trend.
The most likely wave count suggests that BONK has completed a five-wave upward movement since its October lows.
BONK/USDT Daily Chart. Source: TradingView
Traders utilize the RSI as a momentum indicator to assess whether a market is overbought or oversold and whether to accumulate or sell an asset.
If the RSI reading is above 50 and the trend is upward, bulls still have an advantage, but if the reading is below 50, the opposite is true.
The daily RSI supports the wave count since it has a generated bearish divergence (green) close to the top.
BONK Price Prediction: Has the Meme Coin Bottomed?
Cryptocurrency trader Trading_Axe had strong words about the recent BONK drop. He criticized the crypto community for urging unipcsbot not to take profits when he was up $12 million on a BONK trade (the X account is now suspended).
Since then, the BONK price is down 70%. He ended the tweet by saying that:
This is why I STRONGLY RECOMMEND not interacting with a lot of the people on CT, they don’t want the best for you. Some would even say, they purposely put you on a pedestal to lose it all. Evil tactics.
However, the technical analysis of the six-hour time frame suggests that a relief rally is expected. This is because of the price action, EW count and RSI readings.
The price action shows that the price broke out from a descending resistance trend line in an increase preceded by a bullish divergence in the six-hour RSI (green).
The wave count indicates this is wave B in an A-B-C corrective structure.
If the count is correct, BONK will increase 80% to the 0.0000220-$0.0000250 resistance, created by the 0.5-0.618 Fib retracement levels. This will complete the B wave.
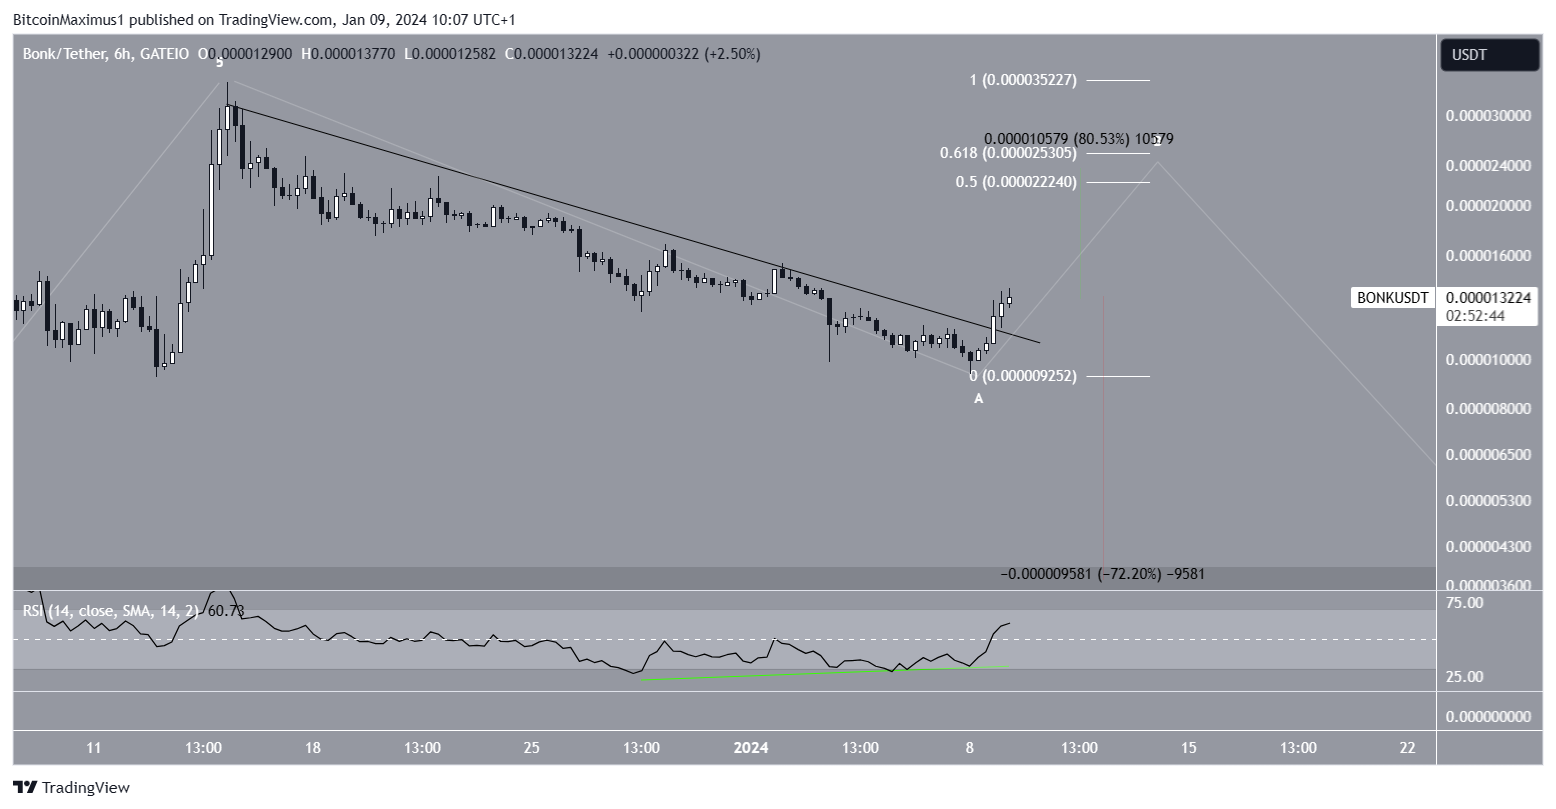
BONK/USDT Six-Hour Chart. Source: TradingView
Despite this bullish BONK price prediction, a decrease below the descending resistance trend line will invalidate the possibility of a bounce. Then, BONK could fall another 70% to the closest support at $0.0000036.
For BeInCrypto‘s latest crypto market analysis, click here.
 to Face Biggest Resistance Since August, Ethereum (ETH) in Poor State")


 Price Reaches Crucial Bull Point: Details")