
Bitcoin’s price currently stands at $71,347, showing an impressive rise within the 24-hour intraday range of $70,065 to $71,595. With a trading volume of $25.17 billion and a market capitalization of $1.4 trillion, bitcoin has gained 4.9% this week, 5.6% over the past two weeks, and 14.4% in the last 30 days.
Bitcoin
Bitcoin’s 1-hour chart reveals a recent recovery following a sharp decline, with a key resistance level at $71,629 and support around $70,116. The higher volume during recent drops indicates strong selling pressure, while the subsequent increase in volume suggests strong buying interest.
BTC/USD daily chart via Bitstamp.
The 4-hour chart maintains an upward trend from approximately $67,281 to a recent peak of $71,759. Consistent with the 1-hour chart, the primary resistance is at $71,759, with support at $70,116. Volume analysis here shows increased activity during upward movements, confirming strong buying interest.
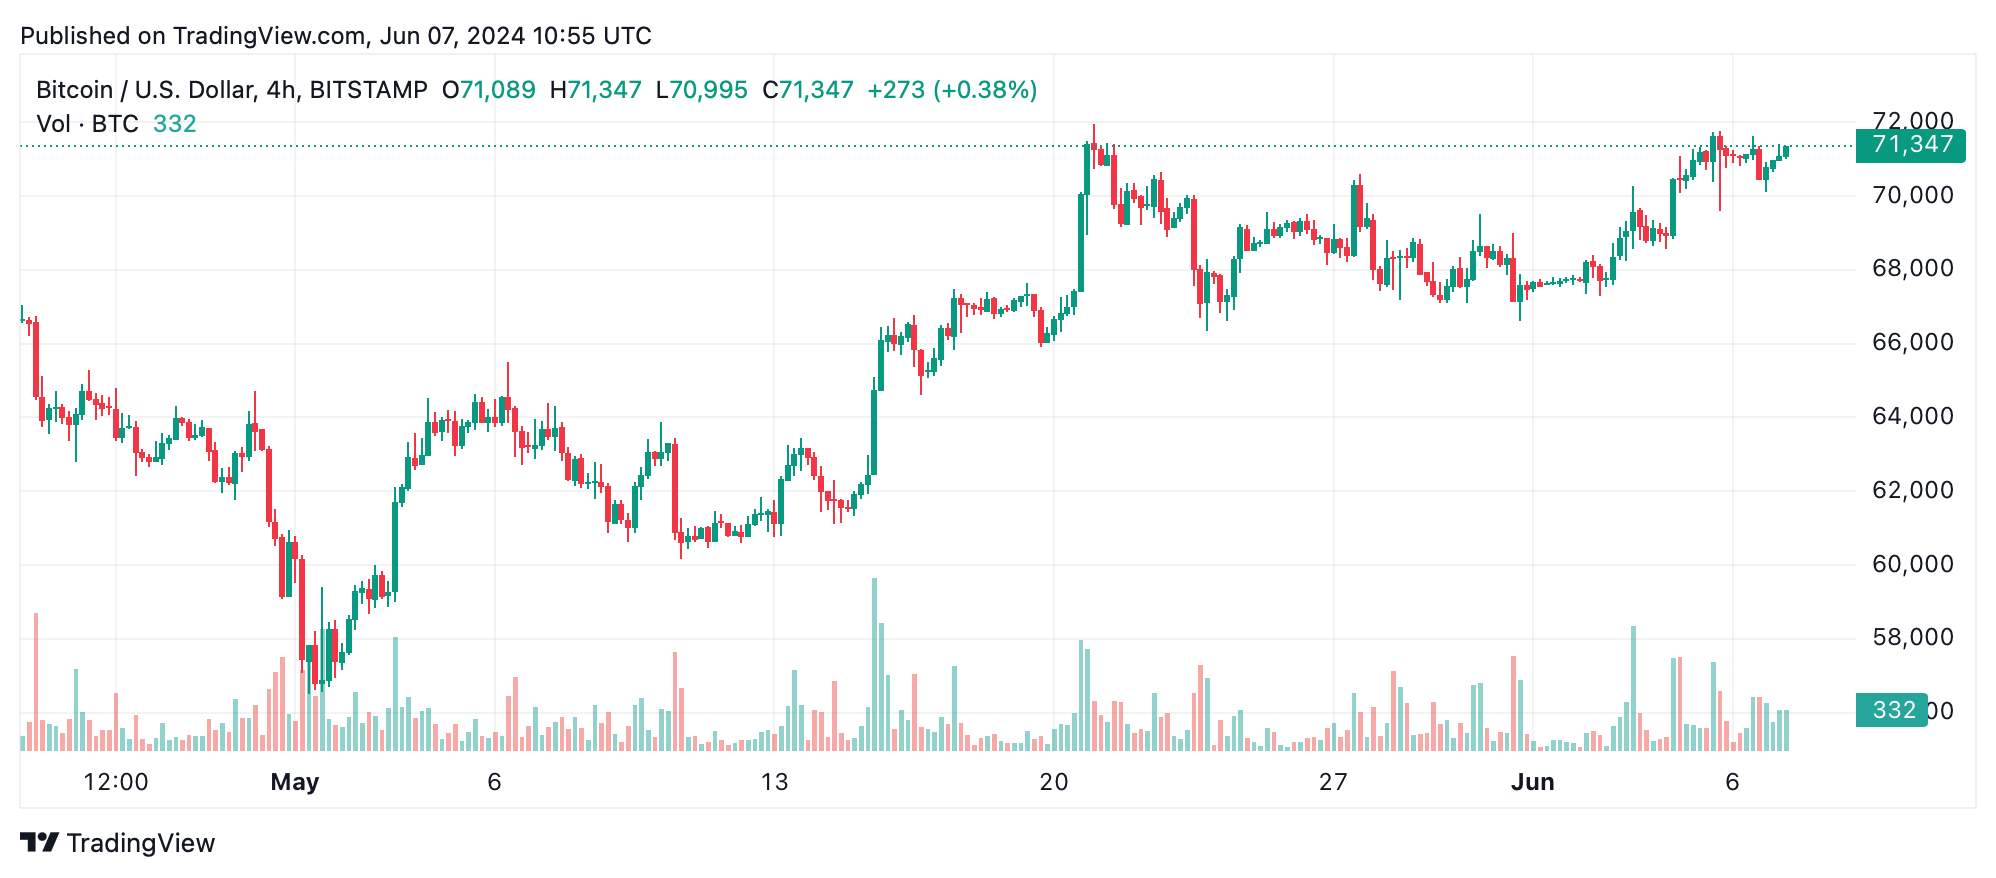
BTC/USD 4-hour chart via Bitstamp.
On the daily chart, bitcoin exhibits a sustained uptrend from $60,176 to a recent high of $71,958. Resistance is set at $71,958, while support is stronger at $67,000. Volume spikes during price surges indicate continued buying interest, whereas decreased volume during consolidations suggests temporary pauses.
BTC/USD oscillator values present a mixed but generally positive outlook. The relative strength index (RSI) at 63 is neutral, and the Stochastic at 86 indicates overbought conditions. The commodity channel index (CCI) suggests bearish sentiment, while the moving average convergence divergence (MACD) and Momentum indicators signal buying opportunities.
Moving averages (MAs) across different periods consistently indicate a strong bullish signal, with both exponential moving averages (EMAs) and simple moving averages (SMAs) above key price levels, reinforcing the bullish sentiment. Longer-term MAs, such as the 50-day EMA at $66,713 and the 50-day SMA at $65,634, indicate positive sentiment.
The 100-day EMA and SMA, at $63,566 and $66,477 respectively, along with the 200-day EMA at $56,491 and the 200-day SMA at $55,282, consistently show buy signals, underscoring the long-term positive outlook for bitcoin. Amidst these technical indicators and market behaviors, bitcoin’s current trajectory suggests a robust resilience to short-term volatilities, underscored by a steadfast bullish momentum over varied time frames.
Bull Verdict:
Given the consistent upward trends observed across the 1-hour, 4-hour, and daily charts, along with strong buying interest indicated by volume spikes and positive moving averages, bitcoin appears poised for further gains. Traders should remain optimistic, watching for key breakouts above resistance levels to capitalize on the ongoing momentum.
Bear Verdict:
Despite the current upward trends, caution is warranted as key oscillators show mixed signals and potential overbought conditions. If bitcoin fails to break above critical resistance levels or exhibits significant selling pressure near support levels, traders should prepare for possible downward corrections and consider protective measures.


 Price Reaches Crucial Bull Point: Details")
