Grayscale’s Bitcoin exchange-traded fund (ETF) faced substantial outflows totaling $2.2 billion last week. This amount surpassed the inflows observed in other funds, culminating in a net outflow of $500 million across global investment vehicles.
BITCOIN ETFs SAW NET OUTFLOWS OF $500M LAST WEEK
Grayscale’s Bitcoin ETF witnessed significant outflows, totaling $2.2 billion last week, surpassing inflows of $1.8 billion into other funds.
Net outflows totaled $500M including global investment vehicles.
Source: CoinShares pic.twitter.com/7EaU3Bk0mF
— Mario Nawfal’s Roundtable (@RoundtableSpace) January 30, 2024
An update on January 29, 2024, revealed that Grayscale’s considerable outflows of $5 billion were effectively absorbed by other Bitcoin ETFs, which saw inflows of $5.8 billion. Despite the significant outflows from Grayscale, the net inflow for Bitcoin ETFs amounted to $759 million.
UPDATE🟠 Grayscale outflows of $5b have been absorbed by other #Bitcoin ETFs taking in $5.8b.
$759m Net Bitcoin ETF inflows.
🫡 @JSeyff pic.twitter.com/4yTzNk1kGr
— Bitcoin Archive (@BTC_Archive) January 29, 2024
Challenges for Spot Bitcoin ETFs Amid Growing Competition
While funds like BlackRock’s IBIT and Fidelity’s FBTC struggle to match the departures from Grayscale’s GBTC, the group of recently launched spot Bitcoin ETFs is facing combined negative flows for the first time since their trading initiation on January 11.
James Seyffart, an analyst at Bloomberg Intelligence, reported that the 10 spot Bitcoin ETFs, including GBTC, encountered a net outflow of $158 million on a particular Wednesday. It’s essential to note that day-to-day flows in the cryptocurrency market can be highly unpredictable.
Day 9 complete for the #Bitcoin ETFs. BlackRock only took in $66 million. -$158 million outflow for the entire group which is the largest single day net outflow so far pic.twitter.com/I8dsFMs9vT
— James Seyffart (@JSeyff) January 25, 2024
According to data compiled from issuers’ websites, the total bitcoin held by all spot ETFs, including GBTC, as of January 24, was approximately 649,000. This reflected a decline of about 11,000 tokens from the previous week’s total, which stood at more than 660,000.
SEC Extends Evaluation Period for Grayscale and BlackRock’s Ethereum ETF Applications
In a related development, federal securities authorities have announced an extended evaluation period for applications submitted by asset managers Grayscale Investments and BlackRock seeking approval for an Ethereum (ETH) exchange-traded fund (ETF).
BREAKING 🚨🇺🇸 SEC DELAYS BLACKROCK ETHEREUM ETF pic.twitter.com/VTCSdZXM34
— That Martini Guy (@MartiniGuyYT) January 24, 2024
On January 24, the United States Securities and Exchange Commission (SEC) issued an order indicating an extended evaluation timeframe for a proposed rule change related to the conversion of Grayscale Ethereum Trust (ETHE) into an exchange-traded fund (ETF). The SEC expressed the need for additional time to thoroughly review the applications submitted by Grayscale Investments and BlackRock, signaling a cautious approach to Ethereum-based ETFs.
What do Analysts Think?
A highly respected figure within the cryptocurrency industry has issued a cautionary statement, predicting that Ethereum’s performance is likely to persistently lag behind that of Bitcoin (BTC), despite the escalating excitement surrounding the potential approval of exchange-traded funds (ETFs) specifically dedicated to Ethereum’s spot market.
Rager shared with his 199,400 followers on the social networking platform X that he is vigilantly monitoring the comparative chart of Ethereum to Bitcoin (ETH/BTC). According to Rager, even though there were indications of a revival earlier this month, the Ethereum to Bitcoin exchange rate is still entrenched in a long-term downward trajectory.
Attention is about to go from just “crypto gaming” to ➡️ quality-gaming in crypto
There will be a few high-quality games that make the biggest impact in this market and industry
Be ready… and here’s a tip, not all the quality games have been released yet but will be in 2024
— Rager (@Rager) January 24, 2024
The expert highlights that Ethereum (ETH) has not proven to be a lucrative trade against Bitcoin (BTC) for an extensive period, except for a brief three-day rally at the outset of January. The sustained downtrend is anticipated to persist until Ethereum (ETH) demonstrates robustness; a setback in the approval of the spot ETF certainly did not contribute positively to the cause.
Rager also expresses skepticism about Ethereum’s capacity to outperform Bitcoin in the foreseeable future. Despite fleeting signs of vitality earlier in the month, the expert asserts that the Ethereum to Bitcoin exchange rate remains ensnared in a prolonged downward trend.
The expert notes that Ethereum’s trade against Bitcoin has been suboptimal for an extended duration, with only a brief respite observed during a three-day rally in the initial days of January. This sustained underperformance, according to Rager, is poised to persist unless Ethereum can exhibit resilience in its market dynamics.
Ethereum’s Reaction to the Delayed Approval
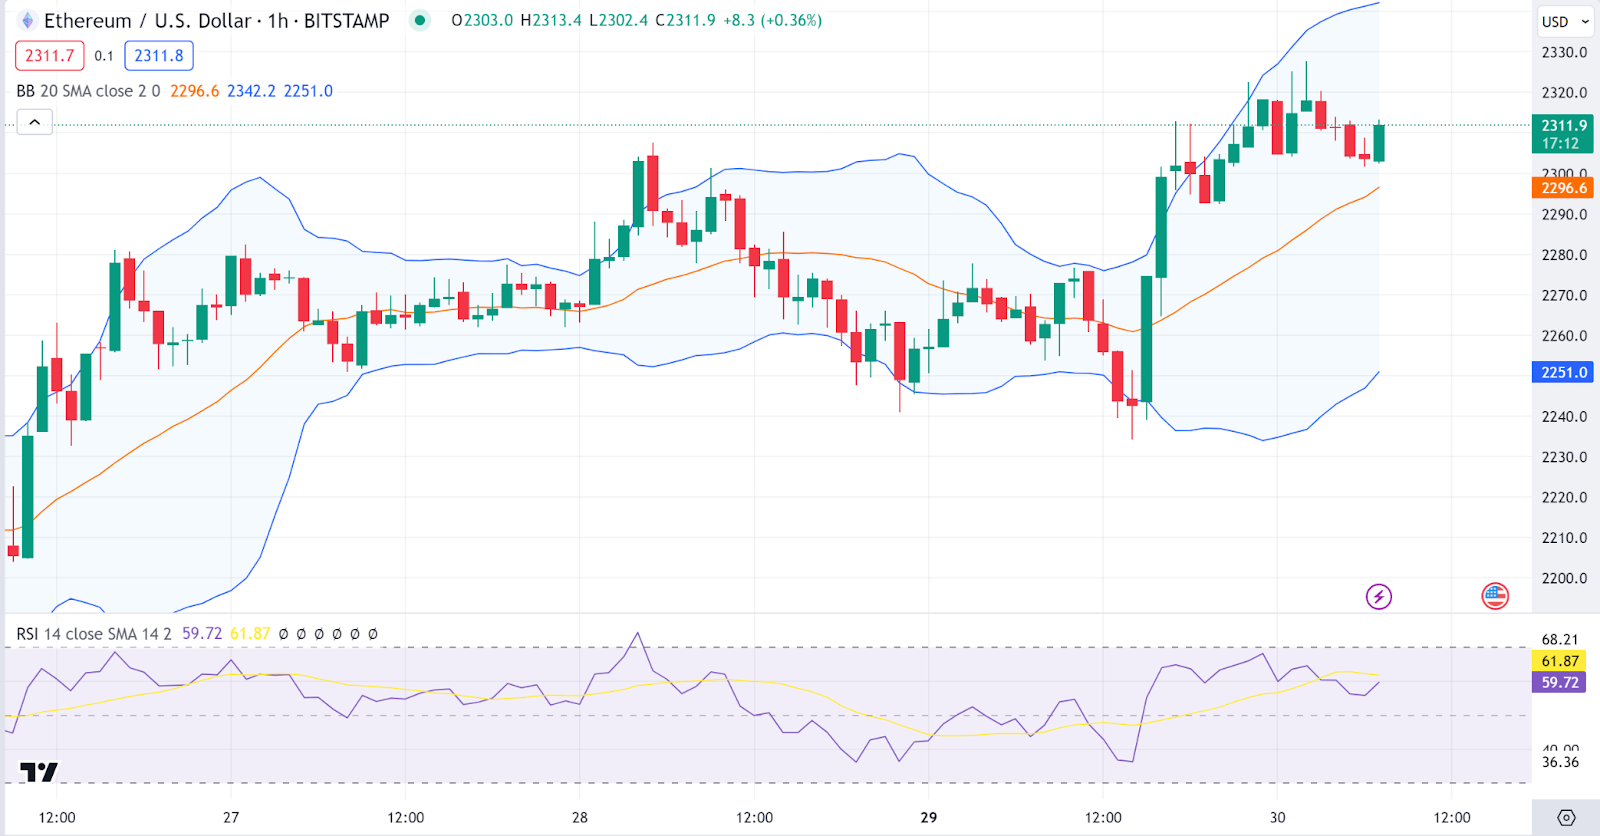
Ethereum, despite the growing anticipation on its ETF approvals, has failed to record impressive stats. This can be attributed to the currency 2.2% drop from its previous 24 hour price to trade at $2313 as of 8:00 a.m. London time.
Looking at a short technical analysis of
The chart shows a
On the other hand, the Relative Strength Index (RSI) is hovering around the 60 level, which is on the higher side but still below the overbought threshold of 70. This suggests that there is still room for upward price movement before the asset is considered overbought.
The recent outflows from Grayscale, coupled with the collective negative flows in newly launched spot Bitcoin ETFs, underscore the shifting dynamics in the cryptocurrency market.
As institutional and retail investors navigate these changes while awaiting the Ethereum ETF approvals, the day-to-day flows remain mercurial, requiring careful observation to assess the potential implications for the broader crypto landscape.
Image Sourced from Forbes | Via: Getty Images


