Market Veteran Michaël van de Poppe predicts a 300% price increase for Chainlink against Bitcoin following rebound from a key support area.
Chainlink (LINK) has shown signs of awakening from a critical support level, suggesting the possibility of significant price increases. Renowned crypto analyst Michaël van de Poppe has identified crucial resistance levels that Chainlink, which presently trades for 0.0002485 BTC, must overcome to sustain its upward momentum.
#Chainlink woke up from the crucial area of support.
Likely, there’s going to be continuation and the low is in.
From this point, I wouldn’t be surprised with at 150-300% price increase. pic.twitter.com/ulweEUpAYV
— Michaël van de Poppe (@CryptoMichNL) May 27, 2024
Chainlink Targets Growth Levels
In his recent analysis, van de Poppe noted that Chainlink is exhibiting signs of recovery from a crucial support zone, highlighted in green on his charts. This support area, slightly below the current trading price, has historically been a rebound point for Chainlink, maintaining its structure.
According to the chart, the cryptocurrency has started to form higher lows and higher highs, a pattern indicative of a bullish trend. This shift in market sentiment suggests that Chainlink could be on the verge of sustained growth.
However, Van de Poppe points out that Chainlink needs to overcome several key resistance levels to continue its upward trajectory, citing the LINK/BTC chart. The primary resistance levels identified are 0.0004480 BTC, 0.0006721 BTC, and 0.0007950 BTC.
Notably, the level at 0.0004480 BTC is particularly significant, as it has previously acted as a formidable barrier. Breaking above this resistance could validate the bullish trend, potentially leading to substantial upward momentum.
Potential Price Gains
Van de Poppe projects two major potential gains for Chainlink if it successfully breaks through the identified resistance levels. The first target is set at 0.0002757 BTC, which represents a 152.52% increase from the critical support level.
Moreover, the second target is at 0.0006055 BTC, indicating a 316.62% gain from the same starting point. These projections highlight Chainlink’s considerable upside potential, assuming it can surpass the crucial resistance barriers.
LINK/BTC Eyes Positive Crossover
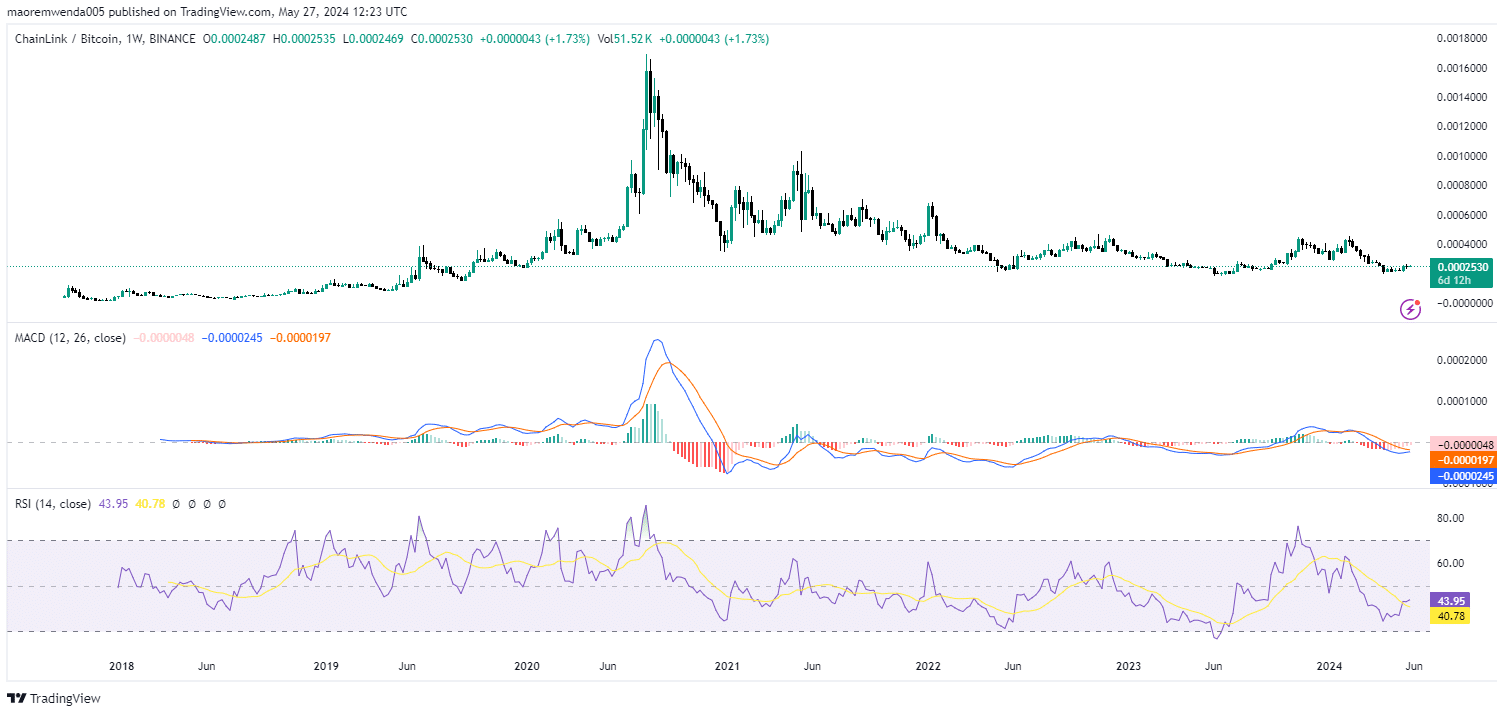
On the weekly chart, the MACD indicator is trending upward and is close to crossing the signal line in the negative region. This movement indicates that the LINK/BTC pair is experiencing an increase in bullish sentiment and may be on the verge of a trend reversal towards higher price levels.
LINKBTC Weekly Chart
Presently, the MACD is positioned at 0.0000245, just below the zero line. The narrowing bars on the MACD’s histogram chart further support the growing strength of the LINK/BTC bullish sentiment, suggesting a potential crossover into the positive region.
Similarly, the RSI indicator crossed above the signal line, indicating a strengthening bullish momentum in the short term. With an RSI positioned at 43.95, there is ample room for the bullish sentiment to continue in the near future.


