These three altcoins exhibit bullish formations against Bitcoin (BTC) and could outperform it in March 2024.
Even though BTC is quickly increasing toward a new all-time high, the following altcoins have bullish formations against it.
Solana (SOL) Price Bounces Off Support
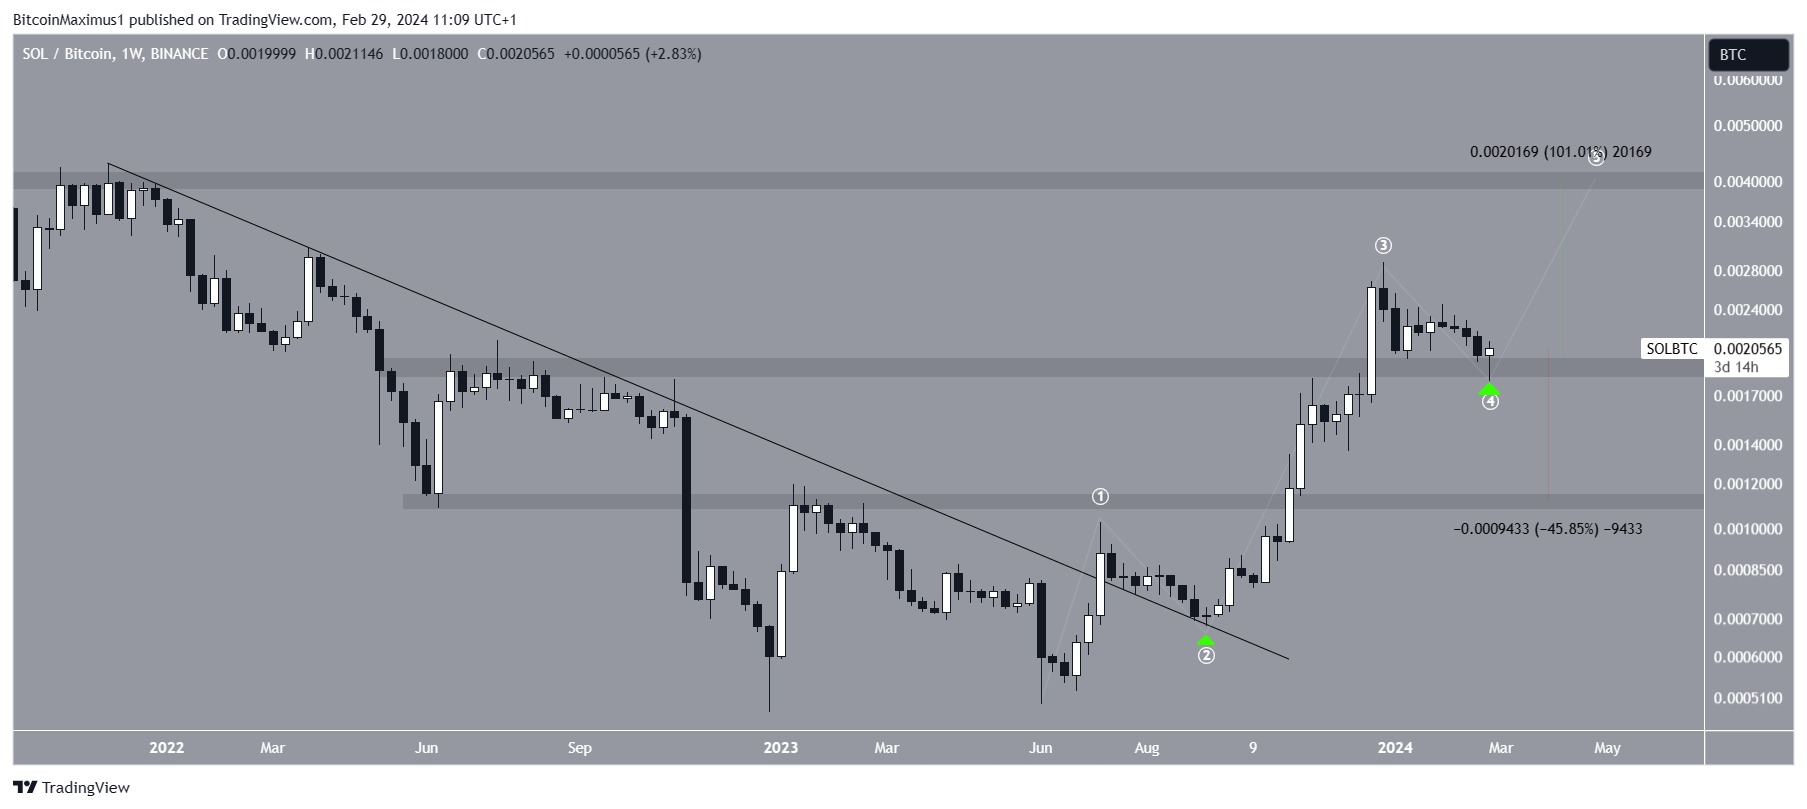
The weekly time frame outlook shows that SOL has increased swiftly since breaking out from a long-term descending resistance trend line and validating it as support (green icon) on September 2023. The increase led to a high of ₿0.0029 in December 2023. Even though SOL fell slightly after the high, it bounced at the ₿0.0020 horizontal area this week.
The wave count suggests that wave four is complete. Elliott Wave theory involves the analysis of recurring long-term price patterns and investor psychology to determine the direction of a trend. According to the wave count, the SOL price has just started wave four and will increase by another 100% to the next resistance at ₿0.0040.
SOL/BTC Weekly Chart. Source: TradingView
Despite the bullish SOL price prediction, closing below the ₿0.040 area will invalidate the count and can trigger a 45% drop to the closest support at ₿0.0011.
Dogecoin (DOGE) Forms Bullish Divergence
The Dogecoin price has fallen under a descending resistance trend line since October 2022. The decrease led to a low of 157 satoshis this week. However, the DOGE price bounced and created a large bullish weekly candlestick. If the weekly close holds, DOGE will break out from the descending resistance trend line, which has existed for 490 days.
A bullish divergence in the RSI preceded the bounce. Traders utilize the RSI as a momentum indicator to assess whether a market is overbought or oversold and whether to accumulate or sell an asset.
If the RSI reading is above 50 and the trend is upward, bulls still have an advantage, but if the reading is below 50, the opposite is true. A bullish divergence occurs when a momentum increase accompanies a price decrease. It often leads to bullish trend reversals.
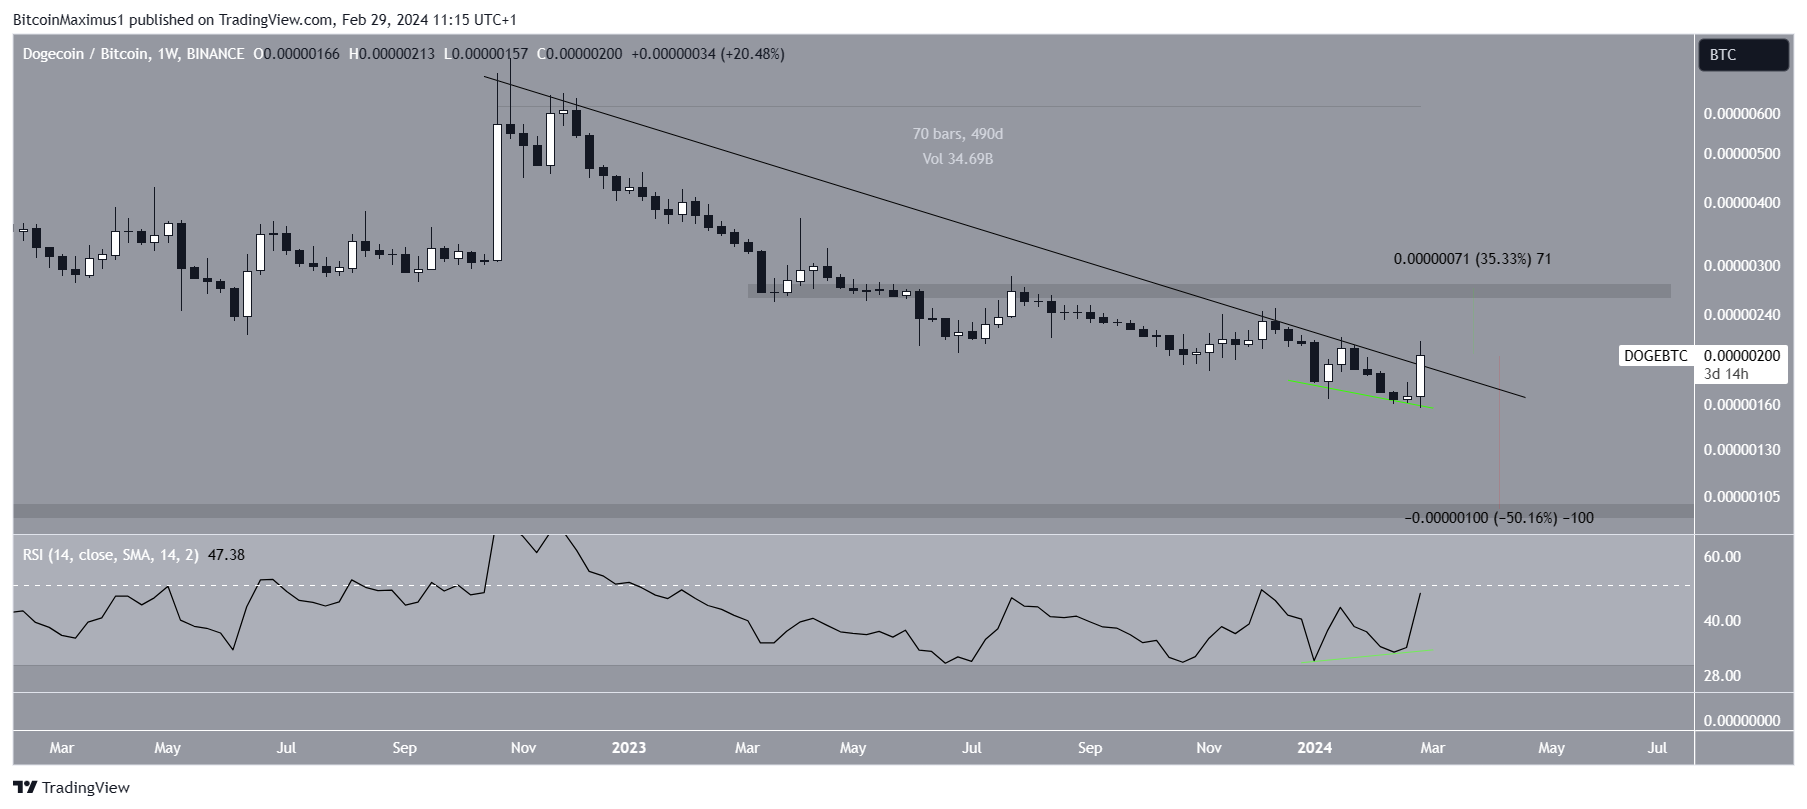
DOGE/BTC Weekly Chart. Source: TradingView
If DOGE confirms the breakout, it can increase by 35% to the next resistance at 270 satoshis. Despite the bullish DOGE price prediction, failure to break out can lead to a 50% drop to the closest support at 100 satoshis.
The Graph (GRT) Appears to Break Out
The final altcoin that could outperform BTC is GRT. The GRT price broke out from a descending resistance trend line that had existed since the all-time high. After bouncing at the trend line (green icon), GRT began an upward movement that caused a breakout above the 450 satoshi resistance area.
The breakout was combined with an RSI increase above 50, legitimizing it. Therefore, if the upward movement continues, The Graph can increase by another 90% to reach the next resistance at 900 satoshis.
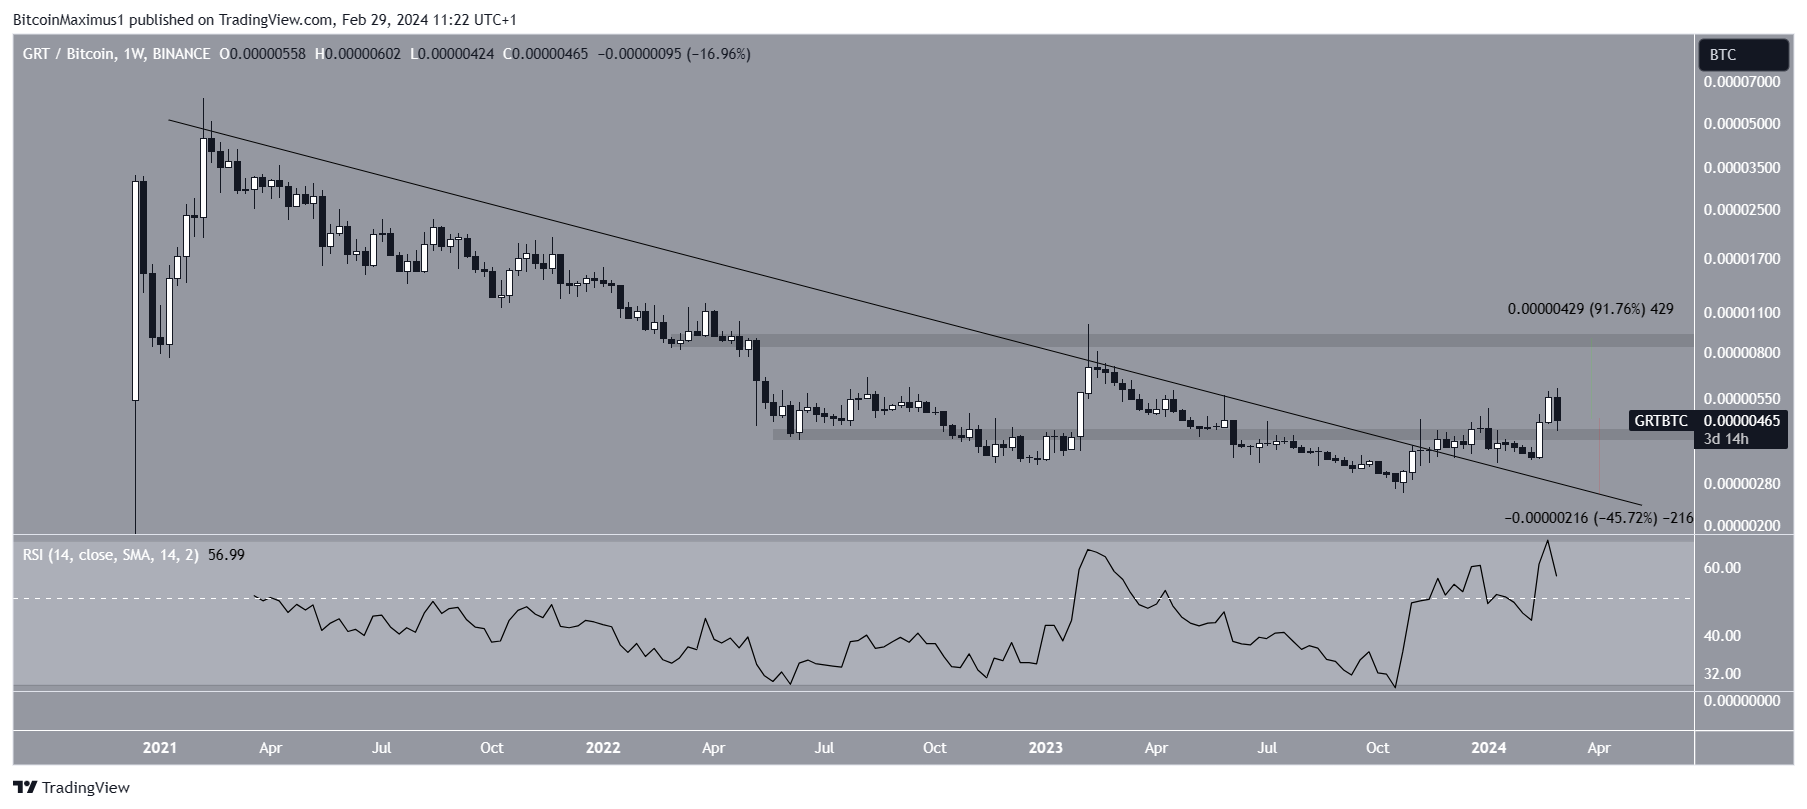
GRT/BTC Weekly Chart. Source: TradingView
Despite the bullish GRT price prediction, closing below the 450 satoshi support area can cause a 45% drop to the resistance trend line at 280 satoshis.
Disclaimer
All the information contained on our website is published in good faith and for general information purposes only. Any action the reader takes upon the information found on our website is strictly at their own risk.

