 Set for 20% Rise? XRP’s EMA Cross Stuns, Toncoin (TON) Reaches Key Milestone")
Sat, 27/07/2024 – 0:30
Disclaimer: The opinions expressed by our writers are their own and do not represent the views of U.Today. The financial and market information provided on U.Today is intended for informational purposes only. U.Today is not liable for any financial losses incurred while trading cryptocurrencies. Conduct your own research by contacting financial experts before making any investment decisions. We believe that all content is accurate as of the date of publication, but certain offers mentioned may no longer be available.
Contents
- XRP’s short-term strength
- Toncoin’s problematic reversal
Advertisement
Given that it is forming a descending wedge pattern on its daily chart, Shiba Inu might be preparing for a big move in price. When conditions are met, descending wedges are usually regarded as bullish reversal patterns, indicating that SHIB could be ready for a 20% increase.
Trendlines with a downward slope that converge at the bottom define the descending wedge pattern. This pattern frequently suggests that the selling pressure is lessening in spite of the general downtrend.
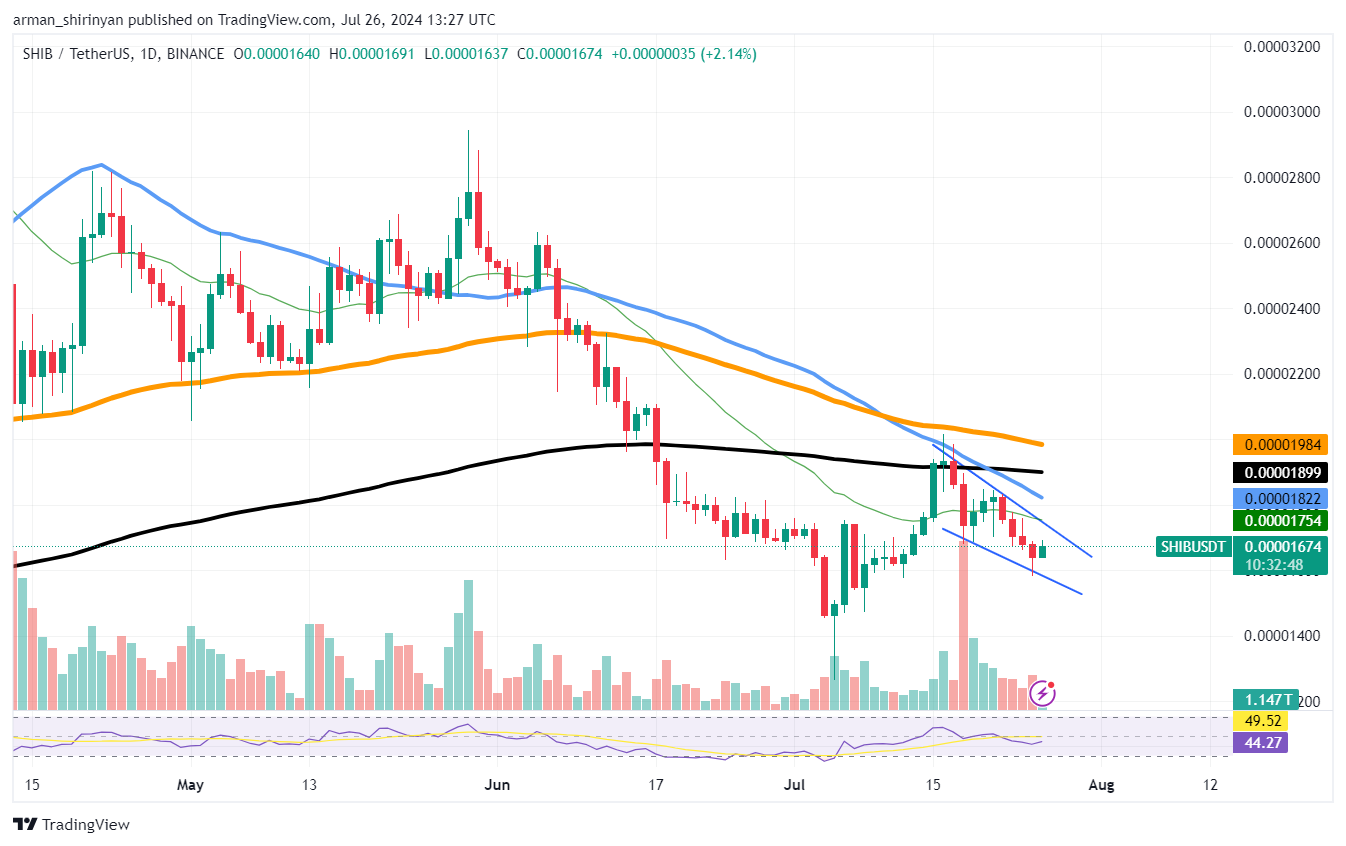
Significant upward movement may occur if the price breaks above the wedge’s upper trendline. This upper trendline represents a crucial resistance level for Shiba Inu to keep an eye on. SHIB is now trading at about $0.00001684, which is marginally above the wedge’s lower edge.
HOT Stories
A large increase in price is possible if the price breaks through the upper trendline with conviction. The chart’s moving averages suggest that the important resistance levels to watch after a breakout are approximately $0.00001899 and $0.00001984. It is imperative to take into account both the recent price behavior of SHIB and the larger market context.
Furthermore, SHIB may still have room for more decline before sustained upward movement because the Relative Strength Index (RSI) indicates that it is not yet in the oversold area.
XRP’s short-term strength
Given that the 26 EMA has crossed above every long-term moving average on the daily chart, XRP’s recent price action has attracted a lot of attention. This crossover suggests that there may be a strong short-term trend and that XRP may retrace toward higher price levels.
An increasing amount of bullish momentum is suggested by the 26 EMA crossing above the 50 EMA, 100 EMA and 200 EMA. Indicators of strong continuation patterns or trend reversals are frequently observed in these crossovers. This crossover is encouraging for XRP, particularly following an extended period of consolidation and declining pressure. An extended uptrend is not assured by this EMA crossover despite its encouraging nature.
Related

The performance of the 50 EMA holds the key to a longer-lasting bullish trend. A more dependable sign of a robust and long-lasting uptrend historically has been the 50 EMA leading the price movement. To confirm a strong upward trajectory, XRP needs to see the 50 EMA take the lead.
Based on the current market price, XRP is trading at approximately $0.60. The range between $0.65 and $0.70 represents the next major resistance levels. The bullish trend may continue if XRP is able to break through these levels with greater volume and sustain support above the 50 EMA.
Toncoin’s problematic reversal
The 100 EMA was recently reached by Toncoin, which has recently fallen to a significant technical level. This level is crucial because it represents the final significant support before the asset may experience a much more severe decline toward the 200 EMA, a move that could seriously weaken the asset’s technical strength.
Investors and traders frequently see the 100 EMA as a strong support level. It is usually believed that when an asset’s price reaches this point, buyers may act to stop the asset from declining any further. But if the 100 EMA support breaks, the 200 EMA offers the next line of protection.
Related

A long-term measure of the general trend and condition of an asset is the 200 EMA. If this line falls, it may indicate a longer bearish trend and result in large losses for Toncoin holders. At the moment, TON is trading slightly above the 100 EMA, at about $6.76. Because traders are closely observing the price action to determine whether this support level will hold, market sentiment surrounding this asset is cautious.
Price strength may be indicated if it bounces back from the 100 EMA and moves above the $7 level. If this level is not maintained, though, it could lead to a wave of sell orders that push the price down to the 200 EMA, which is currently at $5.54.


 Price Reaches Crucial Bull Point: Details")
