Fri, 31/05/2024 – 0:30
Disclaimer: The opinions expressed by our writers are their own and do not represent the views of U.Today. The financial and market information provided on U.Today is intended for informational purposes only. U.Today is not liable for any financial losses incurred while trading cryptocurrencies. Conduct your own research by contacting financial experts before making any investment decisions. We believe that all content is accurate as of the date of publication, but certain offers mentioned may no longer be available.
Contents
- Bitcoin’s future
- Solana bears are not that strong
Advertisement
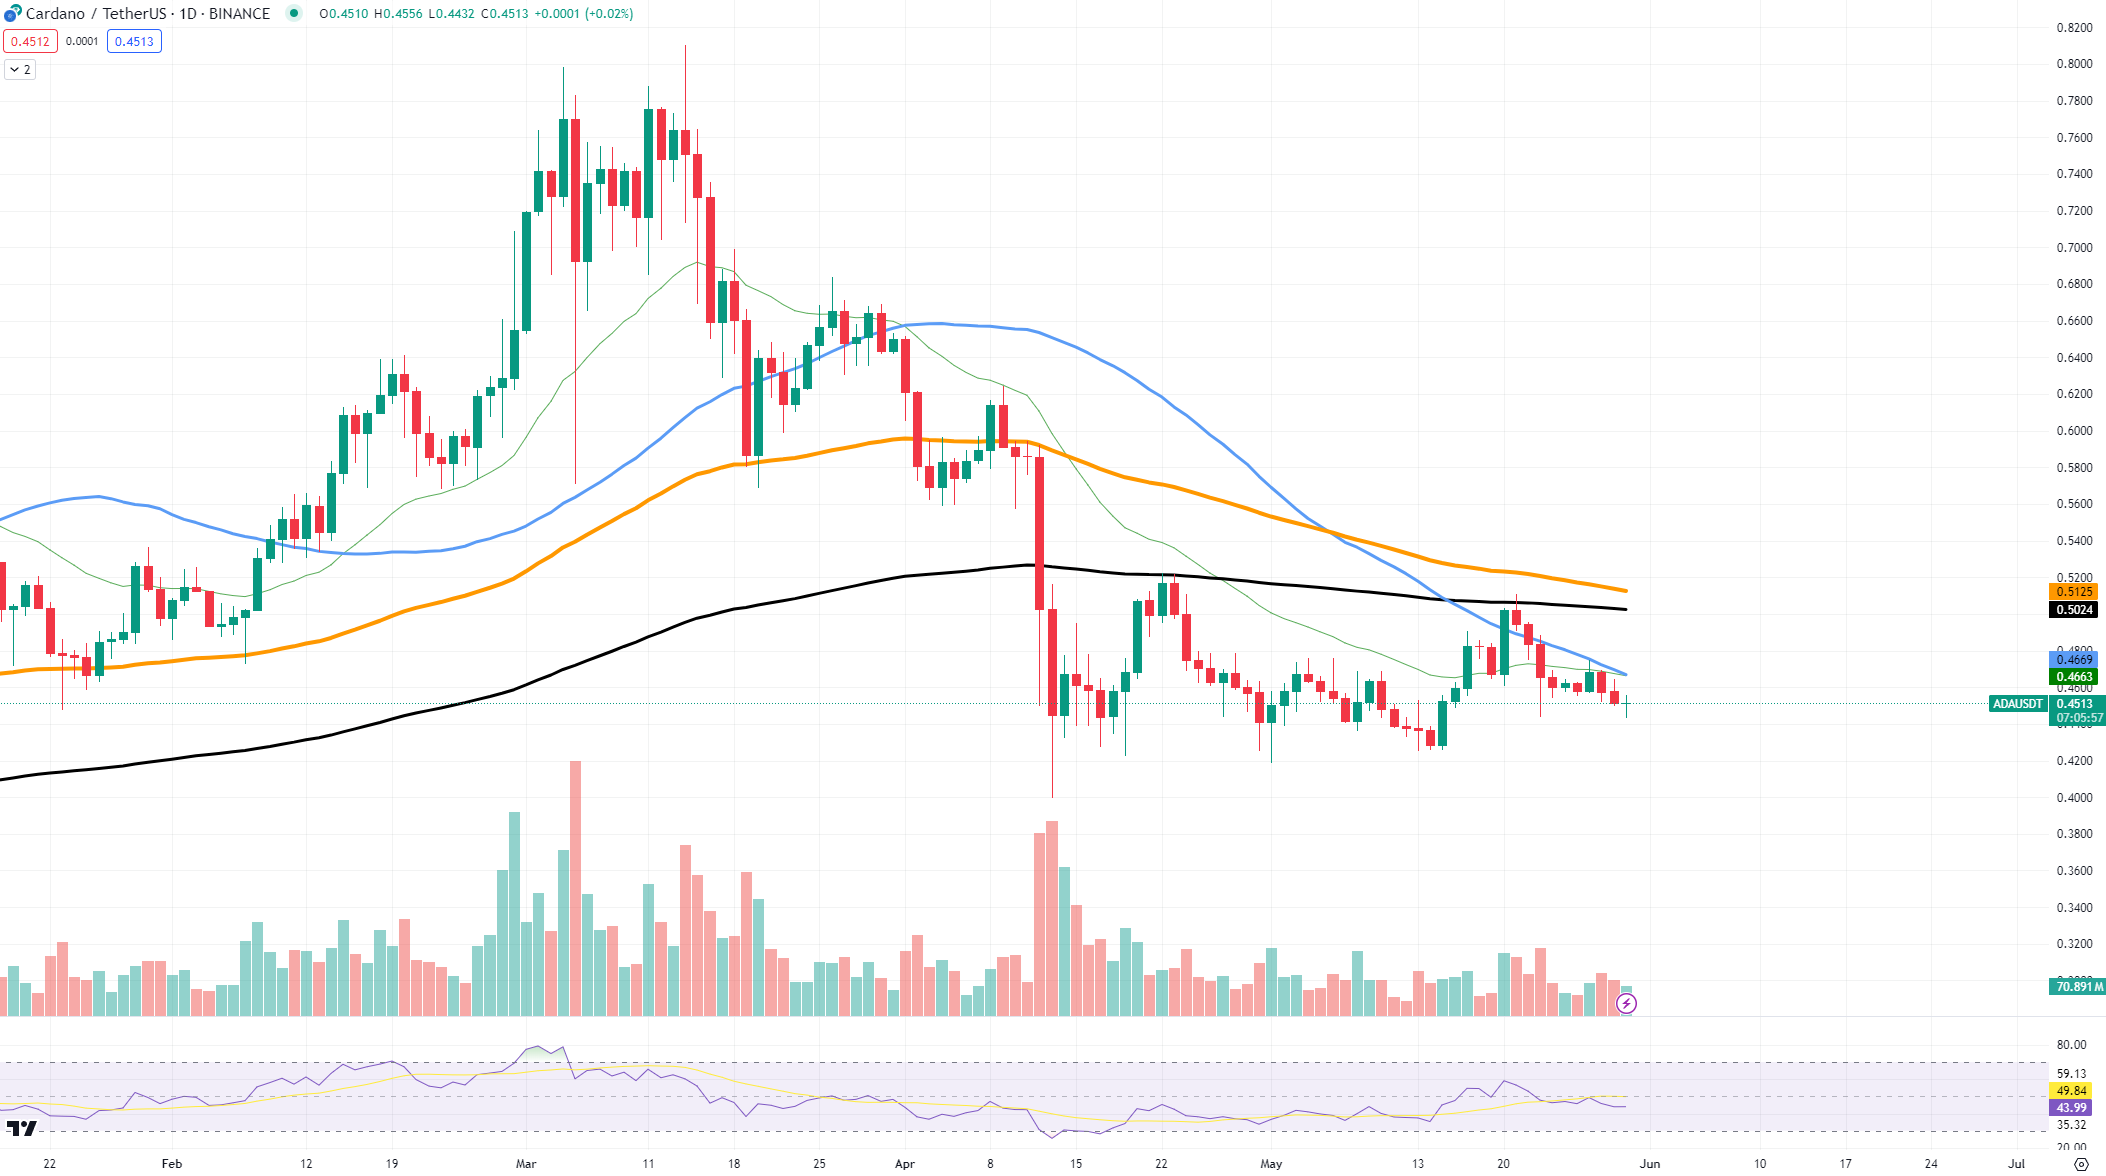
Cardano is probably in the worst shape we have seen this year. In its current state, ADA is moving below all key moving averages on midterm charts. Unfortunately, the key reasons behind such poor performance are multidimensional and go back to the fundamentals of Cardano.
The chart looks grim for ADA. The cryptocurrency has been seen exchanging under its 50-day, 100-day and 200-day EMAs. This implies a bearish trend. All of this underperformance contrasts sharply with the optimism surrounding Cardano earlier in the year. The inability to hold above these ever-important levels likely indicates that there is little buying interest and, therefore, confidence in ADA, in which maximum caution is necessary.

One of the primary reasons behind this decline is the high-level competition within the blockchain ecosystem. While Cardano has been making strides in setting up an ecosystem around the platform, it is, in particular, catching up with more popular ones, like Ethereum and Solana.
Bitcoin’s future
Bitcoin has breached the $70,000 threshold but has failed to gain a foothold above it. Unfortunately, the market is reacting in a weird way: the Ethereum ETF craze brings mixed tendencies to the market, from extra bullish sentiment to suppressed market performance in the matter of days if not hours.
BTC price action ran into a strong barrier after an upside break through the psychological level of $70,000, slightly drawing back into consolidation around $67,500. From the chart below, it is evident that Bitcoin is fiercely trying to stay well above key moving averages, among them the 50-day and the 100-day EMAs.
This was further confirmed by the vast spikes and falls registered in volumes over the past few days. Wild volume indicates an absolute lack of committed direction or confidence among traders.
Obviously, do not forget about the Ethereum ETF craze. On the one hand, the approval of Ethereum ETFs sparks fresh optimism and an overall bullish tone — one that has been reflected in skyrocketing prices and activity.
Going forward, these acceptances may help Bitcoin stay at levels from which it can push higher. Next in line is the 50-day exponential moving average at the dynamic support level of $66,683, with the 100-day EMA closing at $64,890. If BTC stays predominantly above these supports, it will give bulls a chance to test the upside of $70,000.
On the contrary, the break of these levels of support will show the continuation of bearish activity, and the next critical support level below it is $62,521. This will probably add to market uncertainty and could bring substantial volatility within range.
Solana bears are not that strong
Despite the current state of Solana, trading volume suggests that SOL bears are slowly losing their power, and keeping up the current pressure on the asset might become impossible in the foreseeable future, hence, the recovery could become a realistic scenario.
Solana has had flatter performance this week after coming in contact with the critical $165 level. It comes after a decent cut for the general market, where most cryptocurrencies have lost value. Trading volumes, in any case, are showing that bearish momentum might be starting to stall out.
The chart reveals SOL being held above critical support levels, mainly the 50-day and 100-day EMAs. This remains a positive indication that the asset has held above these moving averages. They are very indicative, though, that the asset is still in a bullish stage despite the pressure on the move to the downside at the moment.
Buying interest in SOL remains steady despite falling volume from those levels at the beginning of the year. Gradually decreasing bearish volume is an early positive sign for buyers of a recovery in control.
With overextended volume on the upper side, look for a move above to signal a new bullish extension phase. Note: If Solana drops through and cannot hold above the $150 support level, it may double top and decline, although that looks less likely now, given current indications.


